

JustCo Holdings (SGX: JCO) filed three documents with the exchange after the market closed on 6 August 2026. Two of them explain why revenue grew 24% in the first half, and they do not give the same answer. The press release attributes the increase to “higher revenue per workstation and an expanded network”. The review of performance inside the financial statements attributes it “mainly due to consolidation of Japan operations in 1H 2026 and better performance among our Mature centres”. Neither statement is untrue. Only one of them mentions the acquisition. Take out North Asia, where the acquired business sits, and the 24% becomes 7.7%.
On the figures themselves the documents agree.
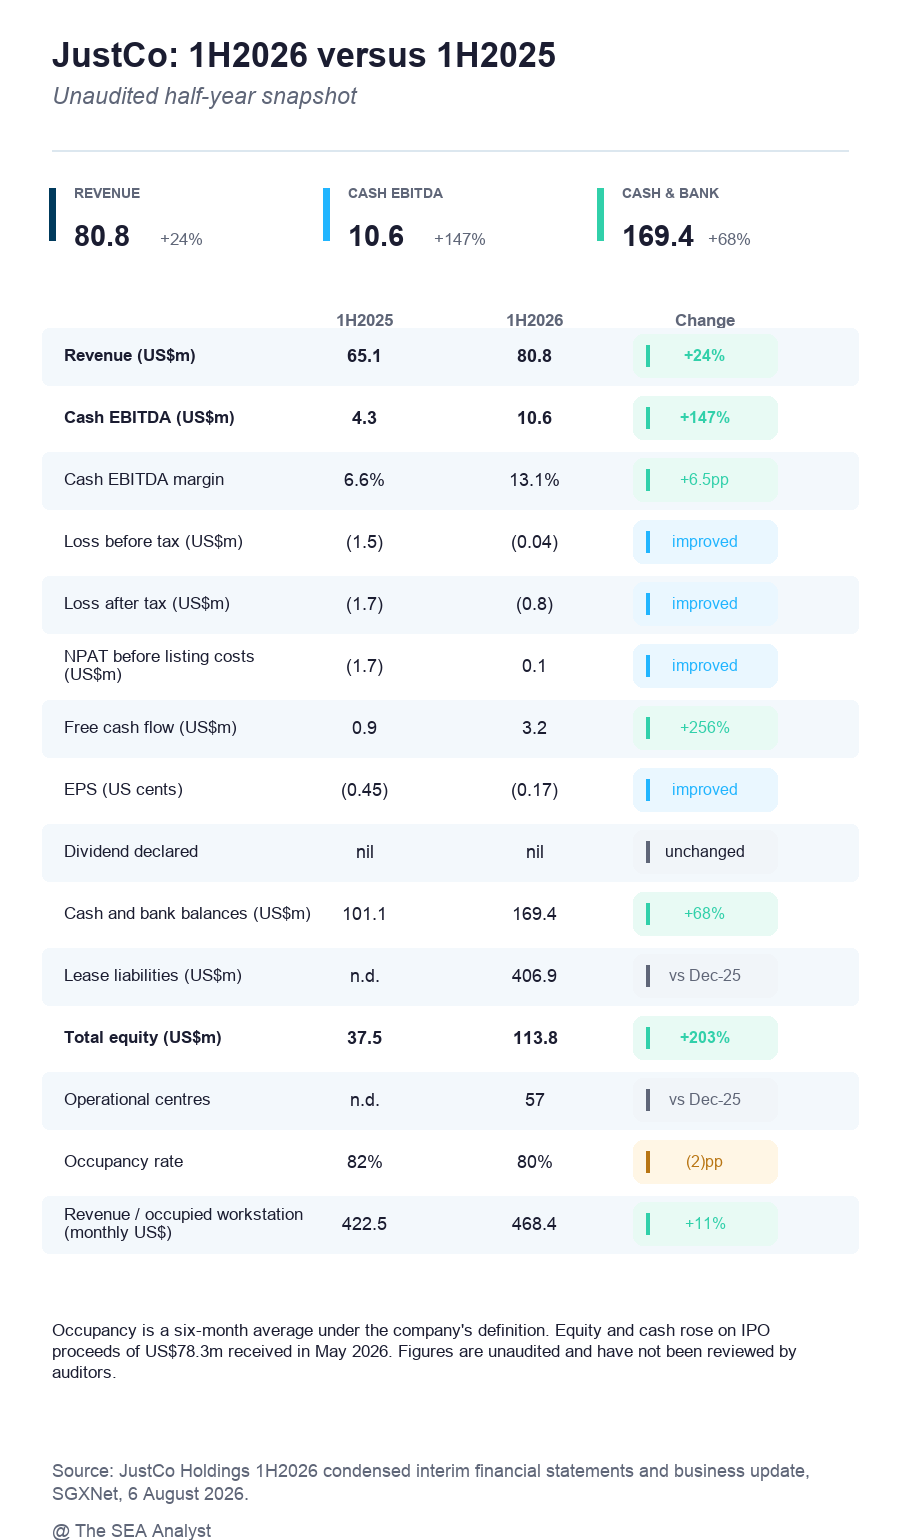
Revenue for the six months to 30 June rose 24% to US$80.8 million.
Cash EBITDA, the company’s measure of what the business generates after rent is actually paid and after corporate costs, rose 147% to US$10.6 million, lifting the margin from 6.6% to 13.1%.
Free cash flow was US$3.2 million, against US$0.9 million a year earlier.
The group ended the half with US$169.4 million of cash and no bank debt.
It also reported a net loss of US$0.8 million, or a profit of US$0.1 million once one-off listing expenses are stripped out [6].
Why Cash EBITDA and not EBITDA. JustCo reports US$52.2 million of EBITDA for the half and US$10.6 million of Cash EBITDA. The difference is mostly rent.
Under IFRS 16, much of the lease cost is taken out of operating expenses and split into depreciation of the right-of-use asset and interest on the lease liability. For a business whose largest cost is rent, EBITDA therefore shows what is left before much of the landlord bill is paid. The operating cash-flow line has the same problem from the other side: JustCo’s US$45.0 million of operating cash flow is struck before the US$42.3 million of lease principal and interest shown in financing cash flow.
Cash EBITDA is JustCo’s attempt to undo that accounting split. It adds back US$7.3 million of accounting rental expense and deducts the full cash rent burden of US$49.5 million, with small adjustments for share-based payment and equity-method operating EBITDA. It is a company-defined measure, not a standard accounting metric, but for this lease-heavy model it is the cleanest reported figure for what the business keeps after the landlords are paid.
Two things came with the numbers.
The board intends to pay out 50% of net profit after tax from FY2027, the first dividend policy in the company’s history.
And the network reached 57 operational centres and 37,350 workstations, from 50 and 35,067 at the end of December, with 21 more centres described as committed.
The shares closed at S$0.630 on 6 August, before the release [13]. In the first session after it, on 7 August, they closed at S$0.640, up 1.6%, having traded between S$0.615 and S$0.660 on 1,282,200 shares against 455,100 the day before [1]. That leaves the stock 32% below the S$0.94 offer price of eleven weeks earlier.
What we said in May, and what we got wrong
Our 15 May initiation read the offer document [8] and declined to give a verdict on the price. The position we published was that both cases were true at once: a working operator with city-level density, and a structure carrying US$402.2 million of lease liabilities against US$40.4 million of equity, priced at roughly 130 times a maiden profit that leaned on a one-off gain. We wrote that the offer was “not a value entry point” and that it “asks the buyer to underwrite the next two years of expansion going broadly to plan”.
That piece named the dependencies but published no scorecard. It said that “every one of the bull points depends on the occupancy cycle staying friendly”, that “the maiden profit is flattered by a one-off”, and that “the raise itself adds 28 centres of fresh lease liability and the associated drag before those centres mature”. We are putting thresholds on those dependencies here, and adding one on how the expansion is paid for, as four tests of the franchise rather than of the price. This result is the first that can score any of them.
The occupancy test fails if group occupancy drops materially below 80%, or if the renewal rate reverses from the 72.0% it reached in FY2025.
Payback fails if new centres stretch well beyond the historical 16.4-month weighted average.
Profitability fails on the first post-listing result that shows an underlying loss once one-off items are stripped.
Funding fails on any sign that the expansion is being paid for by re-leveraging instead of by the IPO proceeds and internal cash.
Two things in that piece were wrong, and the second one we only found on re-reading the prospectus for this update.
The first is the call itself. We wrote that the post-listing share price would "partly reflect scarcity rather than fundamentals, which flatters it now and creates an overhang later". Instead the stock opened at S$0.835, closed its first day at S$0.775, 17.6% below the offer price, on 10.9 million shares [2], and has since traded as low as S$0.495 [1][3]. Scarcity supported nothing. The cohort was weak too, with all six companies that listed on SGX in 2026 trading flat or below their offer price as at 22 July [5], though that report gives no magnitudes, so we cannot say where JustCo's 32% ranks among them.
The second is the arithmetic underneath it. We described the float as 6.6% and said the cornerstone tranche would be released by a six-month moratorium in the fourth quarter. The offering was indeed 32,092,000 shares, or 6.56%. But the prospectus states plainly that “the Cornerstone Investors are not subject to any lock-up restrictions in respect of their shareholdings” [8]. Their 74,291,000 shares, a further 15.19%, could be sold from day one. The sellable pool at listing was therefore about 21.7% of the company, not 6.6%, and there is no cornerstone unlock ahead to price. We got that wrong in May and we are correcting it here.
The filings also show how thin the real demand was. DBS, as stabilising manager, bought 5,319,000 shares between listing and the close on 2 June, when it told the market that the over-allotment had been fully covered and the option would not be exercised [9]. That figure is 16.6% of the entire offering [10]. Through those first two weeks of trading, DBS bought back the equivalent of one share in six of the 32,092,000 Offering Shares. The price fell further once that stopped.
Where the growth came from
The revenue increase decomposes cleanly. Average occupied workstations rose about 12%, and revenue per occupied workstation rose 11%. Multiply the two and you have the 24%.
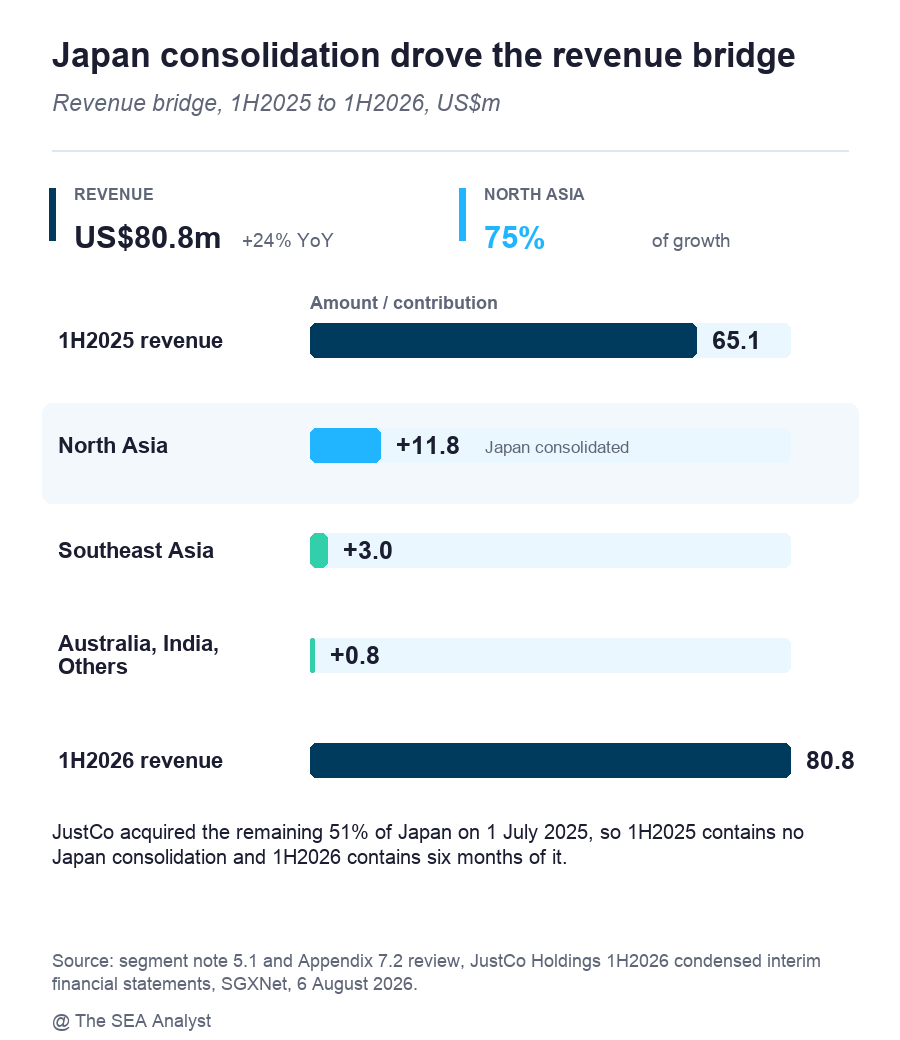
The extra workstations came from an acquisition. JustCo bought the remaining 51% of its Japan operations on 1 July 2025, so the first half of 2025 contains no consolidated Japan revenue and the first half of 2026 contains six months of it. Japan was an associate before that, so a share of its operating EBITDA does sit in the 1H2025 Cash EBITDA reconciliation, US$0.3 million of it, recorded in North Asia. That is the acquisition the review of performance names and the press release does not.
North Asia revenue went from US$15.3 million to US$27.1 million. That single segment accounts for 75% of the group’s entire revenue increase. On Cash EBITDA, North Asia went from US$1.1 million to US$5.4 million, or 68% of the group’s increase on the reported basis, and 73% if the equity-method share is stripped out of the 1H2025 base. Strip North Asia out and group revenue grew 7.7%.
Two operating metrics that JustCo published at the IPO are absent from all three documents it filed on 6 August: the membership renewal rate and the payback period on new centres [6][8]. For a business whose memberships run about 15 months against leases of three to fifteen years, those are the two numbers that say whether the model is working. Neither has been published since the prospectus.
Below the paywall: the half of the business with no acquisition in it more than doubled its Cash EBITDA. Rent took about 95% of the cash the business generated, leaving US$2.7 million. We score the result against four tests of the franchise, including the metric the company published at the IPO, and restate every valuation anchor at the 7 August close.