

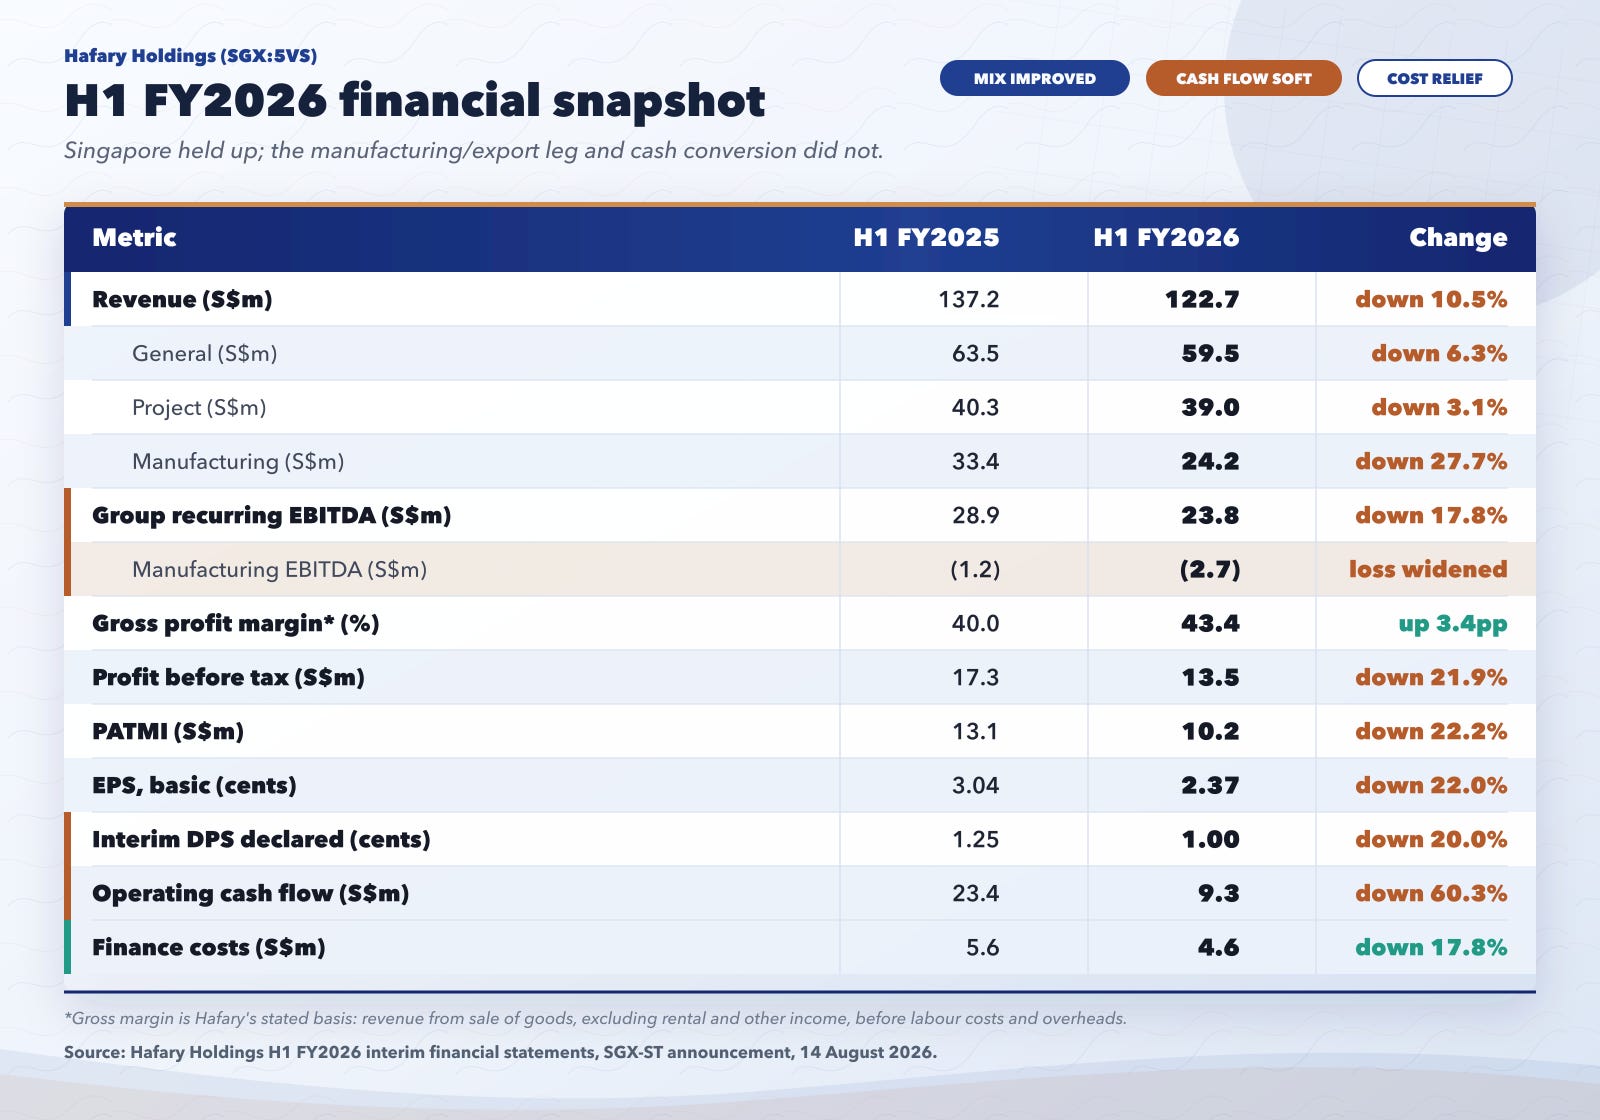
On 14 August 2026, Hafary Holdings reported results for the six months ended 30 June 2026. Group revenue fell 10.5% to S$122.7 million, from S$137.2 million a year earlier. Profit attributable to owners dropped 22.2% to S$10.2 million, and basic earnings per share came in at 2.37 cents, down from 3.04 cents.
The board declared a first-half dividend of 1.00 cent per share (an interim of 0.75 cent plus a special interim of 0.25 cent), against 1.25 cents in the same period last year, where the special component was 0.50 cent.
The decline was broad, but it was not even. The two distribution segments held up reasonably: General (retail and showroom) revenue fell 6.3% to S$59.5 million and Project (developer and contract) revenue fell 3.1% to S$39.0 million.
The damage was concentrated in Manufacturing, where revenue fell 27.7% to S$24.2 million. More important than the top line, the Manufacturing segment’s recurring EBITDA loss widened, from S$1.2 million in H1 FY2025 to S$2.7 million in H1 FY2026, and at the operating level (the group’s “ORBIT” measure) the segment lost S$4.1 million, against S$2.6 million a year earlier.
That single fact reframes the half. The bull case set out in April rested on the Kluang manufacturing operation moving toward breakeven and then into a 10–15% operating margin at scale. In its first reported period since the initiation, the segment moved in the opposite direction.
What the initiation said
The 19 April 2026 initiation described Hafary as a company that had “evolved from a single-product tile trader into a S$287 million revenue platform spanning distribution, project supply, and manufacturing across multiple geographies,” anchored on a 50–60% share of Singapore’s general consumer tile market built over four decades.

The central, explicitly stated question was whether the manufacturing segment, still approaching breakeven, could deliver on its promise of margin expansion and export-driven growth. If it did, Hafary’s earnings power would step up meaningfully. If it did not, the company would remain a well-run distributor with elevated leverage from its aggressive expansion phase.
The flip triggers attached to that thesis were specific. On the bull side, the case would break if manufacturing failed to reach breakeven by FY2026 (the breakeven point the initiation cited), if US tariff policy turned against Malaysian tile exports, or if Singapore construction demand fell materially below the BCA forecast. On the bear side, the case would strengthen if manufacturing reached a 10–15% operating margin at scale, if net debt to equity fell below 1.5x, or if a second or third overseas market matured past S$15 million.
The initiation carried an implied timeline, that manufacturing would be finding its footing around FY2026, and this half moved against it: the loss widened on falling revenue rather than converging on breakeven. That is what changed since April, and it is what this update has to make sense of.
The numbers, and the disclosure that reframes them
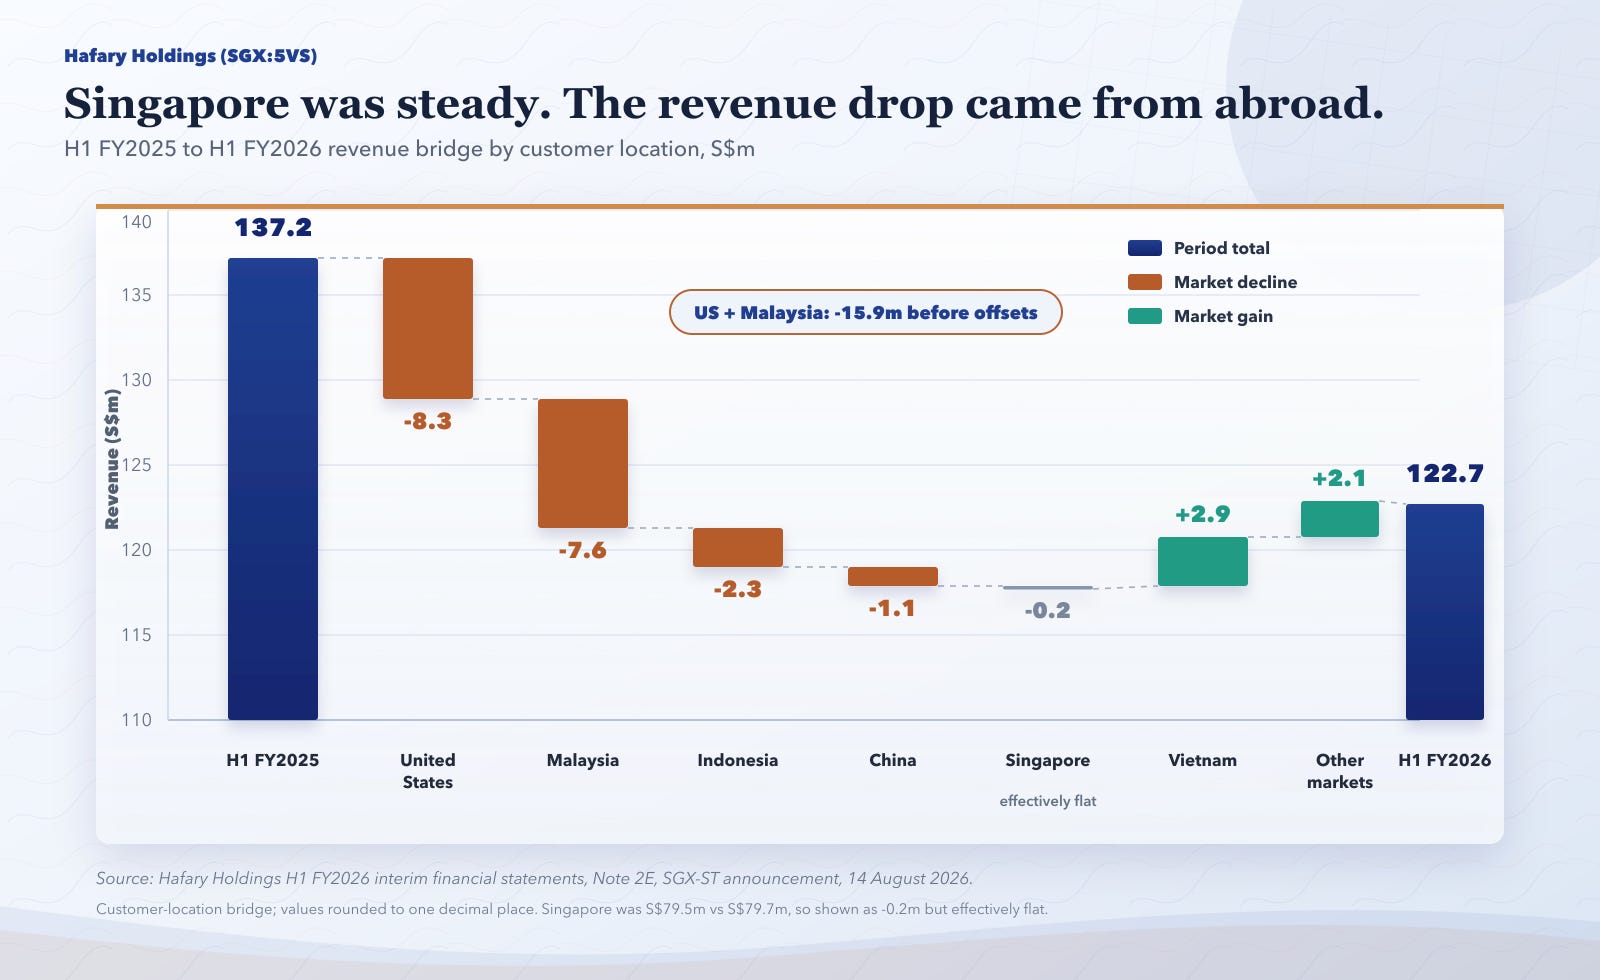
The single most clarifying disclosure in the filing is the geographic revenue split, because it relocates the entire decline.
Singapore revenue was essentially flat (S$79.5 million against S$79.7 million a year earlier, a 0.3% dip), so the domestic distribution core, roughly two-thirds of the group, did not weaken. The S$14.5 million fall came almost entirely from abroad, and it was concentrated: the United States dropped 42% to S$11.4 million (from S$19.7 million), Malaysia fell 28% to S$19.7 million, Indonesia collapsed to S$0.1 million from S$2.4 million, and China slipped to S$3.3 million from S$4.4 million, partly offset by a jump in Vietnam.
Those declining markets are the ones the Kluang plants predominantly sell into (the US export leg and Malaysian domestic demand), so the manufacturing-segment slump and this export-market slump are, on reasonable inference, the same event seen from two angles.
One caveat sits under that inference: the filing reports revenue by customer location, not by plant origin, so the link between the geographic decline and the manufacturing segment is a reasonable read, not a reconciliation the company discloses. Either way, the deceleration is not a Singapore construction story: the problem sits in overseas manufactured-tile demand, not the domestic franchise.
That also explains a number that would otherwise look strange: group gross margin rose, to 43.4% from 40.0% on the filing’s stated basis.
As the lower-contribution manufactured-and-export-linked volume shrank, the mix tilted back toward higher-margin Singapore distribution, lifting the blended gross margin even as revenue and profit fell. The profit decline, then, was not mainly a pricing or gross-margin failure: it was volume, higher inventory impairment, and operating deleverage on the manufacturing base.
That cuts two ways. It is reassuring, because a volume dip is easier to recover from than a collapse in pricing, and Hafary's margins in fact held up. But it is also the more concerning kind of finding, because the weakness is not spread across the business; it sits squarely in manufacturing and exports, the exact part the bull case depends on.
Beyond the snapshot, three further numbers matter more than the headline profit decline.
The first is operating cash flow, which fell 60% to S$9.3 million from S$23.4 million. Operating cash flow before working-capital movements was still healthy at S$26.2 million; the shortfall came almost entirely from working capital, which consumed S$12.7 million. Inventory alone absorbed S$8.2 million of cash, and a S$9.2 million reduction in trade and other payables took more. This is the mirror image of the FY2025 story, where operating cash flow had more than doubled to S$57.9 million on improved working-capital discipline. One soft half does not undo that, but it does show how quickly the cash conversion can swing when demand softens and inventory keeps arriving.
The second is inventory itself, which rose to S$132.4 million at 30 June from S$124.1 million at year-end, building into a market that was buying less. The oversupply signal sits in finished goods, which rose to S$120.2 million; work-in-progress also climbed, to S$7.5 million from S$0.8 million, indicating the Kluang lines kept producing even as sell-through slowed. The group booked a further S$2.3 million allowance for inventory impairment during the half, up from S$0.5 million a year earlier, lifting the cumulative allowance balance to S$23.2 million, about 15% of gross inventory (S$23.2 million against S$155.6 million gross, before the allowance). The initiation flagged the S$124 million inventory book (266 days of turnover) as a specific impairment risk. This half is the first evidence of that risk crystallising, in small but rising increments.
The third is the dividend. The interim payout was cut to 1.00 cent from 1.25 cents, entirely through halving the special interim component from 0.50 to 0.25 cent. The ordinary interim of 0.75 cent was held. Management framed nothing around this, and the results carried no prospect statement at all, but the signal is legible on its own: the board chose to conserve about S$1.1 million of cash rather than defend a headline first-half figure. For a stock whose appeal to income buyers rested partly on an unbroken, growing dividend record, it is a meaningful gesture even if the ordinary portion is intact.
Not everything moved the wrong way. Finance costs fell 17.8% to S$4.6 million, with interest on borrowings down 19.1% to S$4.2 million, as lower rates and the FY2025 deleveraging fed through; annualised, finance costs are now tracking below the S$10.7 million FY2025 full-year figure. The overseas equity-accounted businesses improved: the Vietnam associate (Viet Ceramics) contributed S$0.3 million of profit share, up from S$0.1 million, and paid the group an S$0.9 million cash dividend during the half; the Myanmar joint venture contributed S$0.7 million, up from S$0.3 million. A translation gain of S$1.5 million (against a S$2.0 million loss last year) meant total comprehensive income actually edged up 2.4% to S$12.1 million despite the fall in reported profit.