
Hafary Holdings: Singapore's Dominant Tile Distributor Is Quietly Becoming a Regional Platform
From a single showroom in 1980 to S$287 million in revenue: inside the company that supplies the surfaces in half of Singapore's homes - and what its pivot to manufacturing could mean for investors.

Hafary Holdings is one of those companies that hides in plain sight. Walk into almost any HDB flat renovated in the last decade, and there is a good chance you are standing on tiles that passed through Hafary’s supply chain. The company commands what industry sources estimate is a 50–60% share of Singapore’s general consumer tile market, operates a network of showrooms from Eunos to Sungei Kadut, and has spent over four decades building supplier relationships that stretch from Italian quarries to Chinese ceramic factories.
And yet, at a trailing P/E of 7.2x and a market cap of just S$215 million, the stock trades as if none of this matters.
This piece is a deep dive into Hafary: its history, business model, financials, competitive advantages, and the strategic pivot that could change the investment case entirely.
A Brief History: From Tile Trader to Integrated Platform
Hafary was founded in 1980 by Low Kok Ann, who started as a small tile trader in Singapore. The business grew steadily through the construction booms of the 1990s and 2000s, eventually listing on the SGX Catalist board in 2010.
For most of its history, Hafary operated a simple but effective model: source tiles and surfacing materials from Europe (mainly Italy and Spain) and Asia, then distribute them through showrooms to retail customers and through project teams to developers and contractors. Two segments, General (retail) and Project (developers), accounted for virtually all revenue.
The company weathered several downturns. Revenue peaked at S$120 million in FY2018 before declining through FY2019–2020, hit by a softening construction cycle and then the COVID-19 circuit breaker, which shut showrooms and halted construction sites for months. FY2020 was the trough: revenue fell 22% to S$84 million, and PATMI dropped 48% to S$5.3 million.
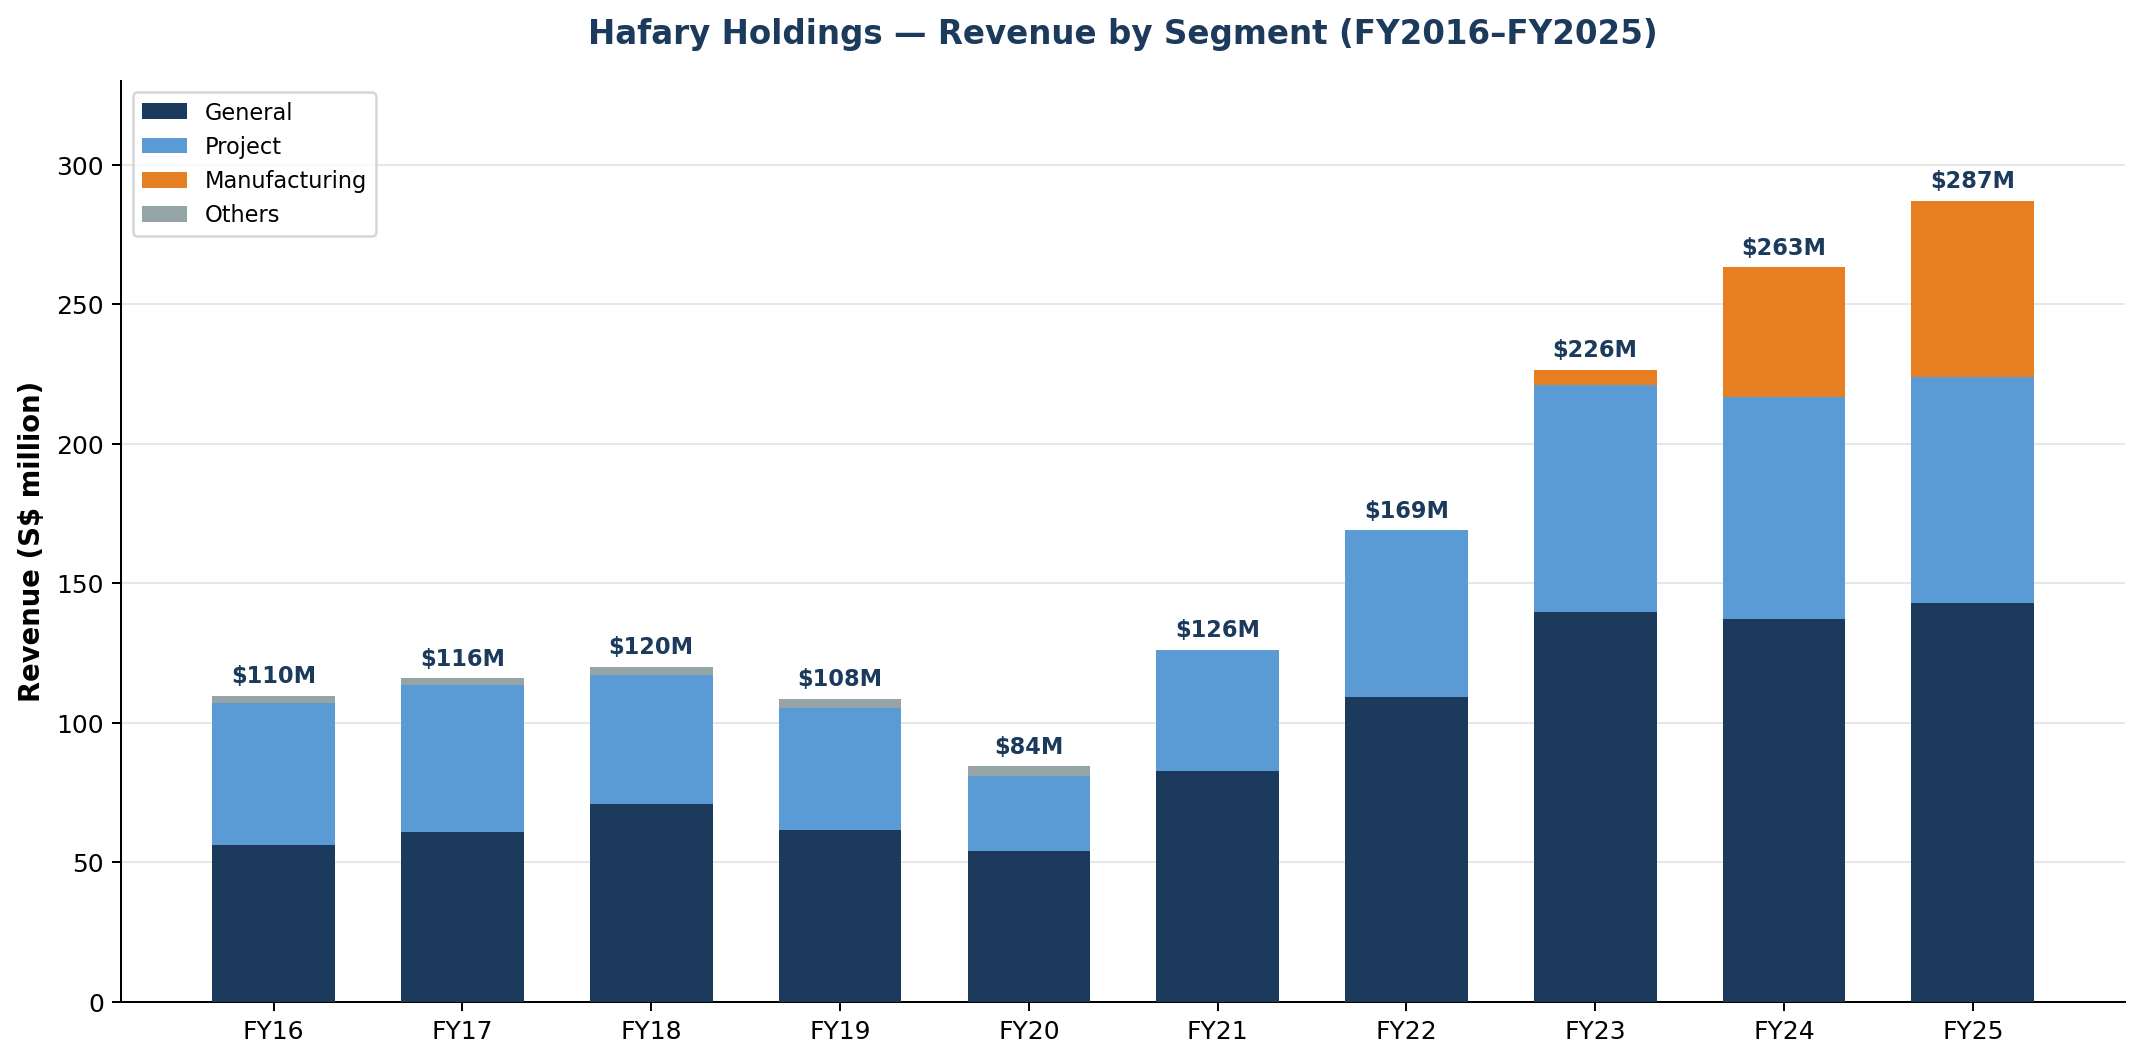
What happened next was remarkable. From that FY2020 low, Hafary’s revenue has grown more than threefold to S$287 million in FY2025. The recovery was driven by three forces: a rebound in Singapore’s construction and renovation activity, geographic expansion into Malaysia and export markets, and, most importantly, the launch of a manufacturing segment that did not exist before FY2023.
Business Model: Three Segments, One Ecosystem
Hafary today operates across three segments.
General (49.7% of FY2025 revenue, S$142.7M): This is the retail-facing arm. Homeowners, interior designers, architects, and renovation contractors purchase tiles, natural stone, wood flooring, countertops, and sanitary ware from Hafary’s showrooms. The company operates multiple showrooms in Singapore (including the flagship Hafary House at 161 Lavender Street) and one in Petaling Jaya, Malaysia. This segment has been the steady base of the business for decades.
Project (28.3%, S$81.2M): Hafary supplies surfacing materials for public sector projects (HDB flats, government buildings, hospitals) and private developments (condominiums, commercial buildings, hotels). Customers include architecture firms, property developers, and construction companies. This segment is more lumpy and contract-driven, but benefits from long-term government infrastructure spending.
Manufacturing (22.0%, S$63.1M): This is the newest and fastest-growing segment. Since commencing ceramic tile production at two facilities in Kluang, Johor in June 2023, manufacturing revenue has surged from S$5.4 million in FY2023 to S$46.5 million in FY2024 and S$63.1 million in FY2025 (a 35.6% year-on-year increase). The segment serves Malaysian and international markets, with the US emerging as a significant export destination (S$35.7 million in FY2025 revenue).
Geographic exposure has diversified meaningfully. Singapore remains the anchor market at S$171.4 million (59.7% of revenue), but Malaysia contributes S$54.5 million (19.0%), the US S$35.7 million (12.4%), and the remaining 8.9% (S$25.5 million) is spread across 12 other countries.
A broader international footprint than the headline numbers suggest. What the geographic revenue table does not fully convey is the network of dedicated entities Hafary has seeded across Asia. In China, the group operates through three distinct vehicles: Foshan Hafary Trading Co. (a wholly owned export agent that widens procurement), Guangdong ITA Element Building Materials Co. (designing and producing glazed porcelain tiles), and the newly acquired MML Shanghai Trading Co. (which contributed to project revenue growth in FY2025). Combined China revenue reached S$8.5 million in FY2025. Indonesia generated S$7.8 million, making it the fourth-largest market by revenue, ahead of China, and yet rarely discussed. In Vietnam, Hafary’s associate, Viet Ceramics International Joint Stock Company, was the group’s first foray into overseas tile retailing. It is carried at S$18.7 million on the balance sheet and contributed S$1.3 million in share of profit in FY2025, making it a quietly profitable investment despite the weakening Vietnamese Dong. In Myanmar, a joint venture (Hafary Myanmar Company Limited) contributed S$0.8 million in share of profit on S$2.1 million in revenue, a solid margin for an early-stage market entry. Smaller but growing presences in Taiwan (S$3.2 million), Thailand (S$835K), Cambodia (S$679K), the Philippines (S$570K), and Australia (S$356K) round out an ASEAN-wide distribution network that is still in its early stages but clearly by design, not by accident.
The strategic logic is clear: each entity serves a different function (sourcing, manufacturing, distribution, or retail) and together they form a regional platform that gives Hafary multiple levers for growth beyond its dominant Singapore base.
But has the international expansion actually delivered? A track record assessment.
Hafary has been promising overseas expansion since at least AR2014, when the corporate profile noted it would “continue to explore overseas opportunities.” Tracking the annual reports year by year reveals a mixed but instructive record.
Vietnam: the longest-running bet (10+ years). Viet Ceramics International (VCI) was described as Hafary’s “first foray into the overseas tile retailing market” as early as the AR2014. By AR2015, it was a clear success: profit contribution of S$2.1 million, five showrooms across Vietnam (including new openings in Ho Chi Minh City’s Phu My Hung district in February 2015 and Hanoi in March 2016), and an Outdoor Sales Department - all credited to Vietnam’s 6.68% GDP growth. By AR2020, COVID had cut VCI’s profit contribution 55.7% to S$1.8 million, down from S$4.0 million in FY2019. By FY2025, the profit share had shrunk further to S$1.3 million, and the carrying value of the associate dropped by S$1.7 million due to the weakening Vietnamese Dong. Vietnam was supposed to be the proof of concept for overseas retail expansion, and it has been consistently profitable, but after more than a decade, it has never scaled beyond a modest profit contributor, and returns are trending in the wrong direction.
China: patient, multi-layered build-out. In AR2014, China was just Foshan Hafary Trading, an export agent. By AR2015, Hafary had completed the refurbishment of a 441,000 square-foot warehouse in Gaoming, Guangzhou, positioned as a logistics hub near a port for quick inventory shipping, with unused space leased for rental income. A pragmatic, low-risk move. By AR2020, a new entity had appeared: Guangdong ITA Element Building Materials Co., which moved Hafary from trading into actual glazed porcelain tile production in China. By FY2025, a third entity, MML Shanghai Trading, acquired from MMSB for S$2.8 million, expanded the project sales base, and combined China revenue reached S$8.5 million. China has been the most disciplined international expansion: each step was functional (sourcing → logistics → production → sales), each was relatively low-cost, and none was oversold in the annual reports. It has quietly become a meaningful market.
Myanmar: the risk that hasn’t killed the venture yet. Hafary Myanmar Company Limited entered a market with high construction growth and low competition. By AR2020, the CEO’s Statement acknowledged the elephant in the room: “With the recent developments in Myanmar arising from the military coup bringing uncertainty and unrest to the country, the performance of Hafary Myanmar may be affected in the next financial year.” That warning was prescient - but remarkably, the JV survived. By FY2025, it was generating S$2.1 million in revenue and S$0.8 million in profit share. The margins suggest it has carved out a viable niche, but the political risk remains existential and largely uncontrollable.
Malaysia: the slow-burn Hap Seng promise that eventually delivered. The AR2015 set expectations clearly: “The business combination between the Company and HSCB is expected to create strong synergistic benefits, as Hafary’s business as a downstream player is complementary to HSCB’s existing involvement in the building materials upstream market segment.” By AR2020, five years after the deal, the synergies had barely materialised. Hafary Trading Sdn Bhd was only incorporated in September 2020 as a wholly owned subsidiary “to capture any potential trading and distribution opportunities in future.” It took until June 2023, eight years after the Hap Seng deal closed, for the manufacturing segment to commence production at the Kluang facilities. But once it did, the results came fast: manufacturing revenue reached S$63.1 million by FY2025, Malaysia became the second-largest market at S$54.5 million, and the US emerged as an entirely new S$35.7 million export market - none of which was even hinted at in earlier annual reports. The Hap Seng synergy promise was real, but it required far more patience than the original framing suggested.
The US: the unannounced success. Not mentioned in any annual report prior to the manufacturing launch, the US went from zero to S$35.7 million in revenue by FY2025, driven entirely by manufactured tile exports from Malaysia. This is perhaps the strongest evidence that the manufacturing pivot has strategic merit. It unlocked a market that the distribution business alone could never have reached.
The scorecard: Malaysia and the US are unambiguous wins, albeit ones that took eight years to materialise. China has been a patient, disciplined build with solid progress. Vietnam has been consistently profitable but is stagnating and exposed to currency risk. Myanmar is profitable against the odds but remains a wild card. The pattern that emerges is that Hafary’s international expansion works best when it is connected to the Hap Seng manufacturing infrastructure (Malaysia, US, China via MML Shanghai) and is more fragile when it depends on standalone retail operations in developing markets (Vietnam, Myanmar). This distinction matters for how investors should weigh the international growth optionality in the bull case.
Industry Overview: Riding Singapore’s Construction Supercycle
The timing of Hafary’s expansion coincides with what analysts describe as a multi-year construction supercycle in Singapore.¹ BCA’s January 2026 release projects construction demand of S$43–46 billion in 2026,² while Hafary’s Chairman’s Statement cites a BCA forecast range of S$47–53 billion³ - the difference likely reflecting the inclusion of different project categories. Either way, the pipeline is substantial, supported by mega-projects including Changi Airport Terminal 5, the Tuas Megaport expansion, Marina Bay Sands IR2, and the ongoing HDB BTO programme.⁴
Singapore’s construction market is valued at approximately USD 25 billion (2025), projected to reach USD 34 billion by 2031 at a 5.4% CAGR.⁵ Medium-term annual demand is forecast at S$39–46 billion per year through 2030.²
For a company that supplies the finishing materials for virtually every type of construction project, this pipeline represents years of sustained downstream demand.
Competitive Advantages and Moat
Hafary’s moat rests on several interlocking advantages.
Market dominance in Singapore tiles. An estimated 50–60% share of the general consumer tile market. This was built over more than four decades through showroom network effects, supplier relationships, and brand recognition among renovation contractors and interior designers (the key decision-influencers in tile purchases).
Entrenched supplier relationships. Hafary is the exclusive Singapore distributor for Antolini, the Italian premium natural stone brand, according to the company. Decades of sourcing relationships with European and Asian manufacturers give the company access to products and pricing that new entrants cannot easily replicate.
Vertical integration via manufacturing, enabled by Hap Seng. The Kluang, Johor manufacturing facilities are strategically significant. They reduce dependence on third-party imports, improve gross margins on manufactured products, enable export to markets like the US (where S$35.7 million in revenue was generated in FY2025), and give Hafary control over quality and lead times. But this capability did not arise organically, it was made possible by Hap Seng’s 2015 acquisition and the subsequent integration with Malaysian Mosaics (MMSB), which brought six decades of ceramic manufacturing expertise and three existing Johor production facilities. Hafary’s manufacturing moat is inseparable from the Hap Seng relationship.
Property asset base. Hafary owns significant real estate: the 161 Lavender Street conservation shophouse block (acquired for S$71.3 million, now operating as Hafary House) and the World Furnishing Hub at 18 Sungei Kadut Street 2 (independently valued at S$72 million). These assets provide operating utility and represent embedded value on the balance sheet.
Durability of the moat: The distribution network and brand are durable; tiles are a fragmented, relationship-driven market, and switching costs for contractors are real (familiarity with product range, credit terms, delivery reliability). The manufacturing moat is earlier-stage and still needs to prove sustained profitability. The Hap Seng relationship is both an enabler and a dependency: it accelerates growth but concentrates strategic risk in a single controlling shareholder.
Financial Performance: A Decade in Numbers
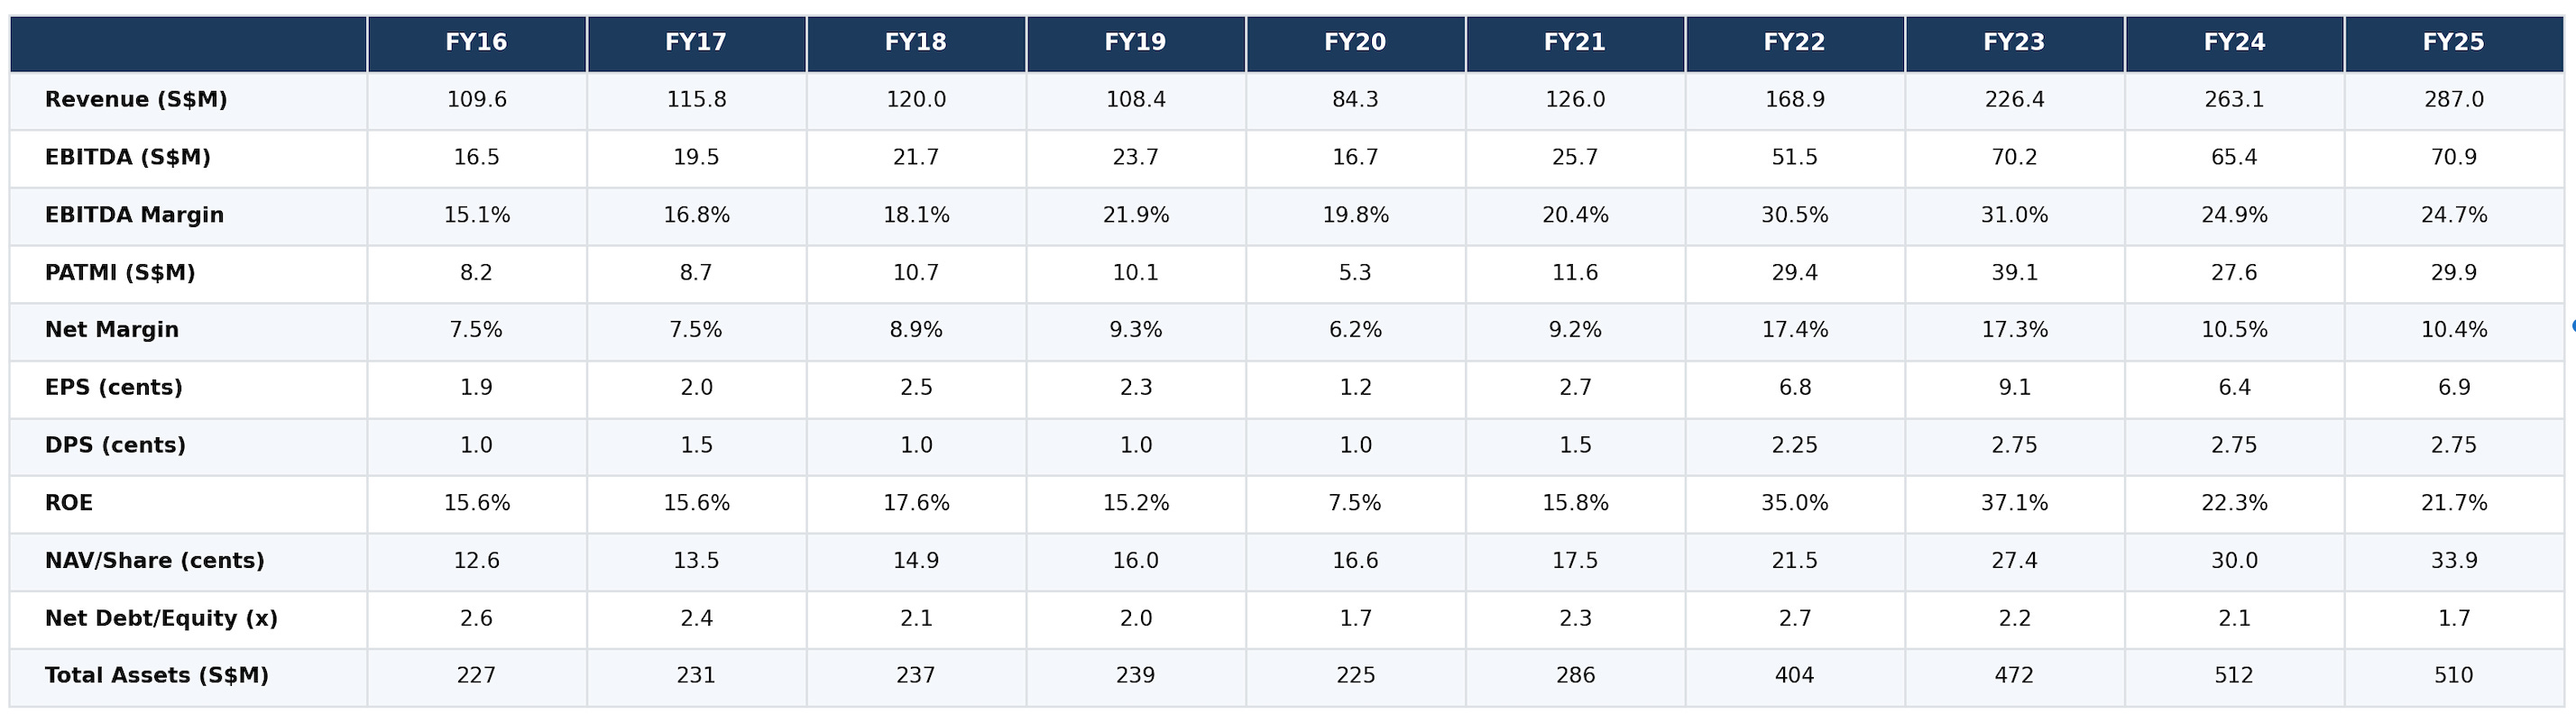
The 10-year financial trajectory tells a clear story: steady pre-COVID growth, a pandemic dip, and then an explosive post-2020 recovery.
Revenue grew from S$109.6 million in FY2016 to S$287.0 million in FY2025, a 2.6x increase, representing an 11.3% CAGR. The manufacturing segment, which did not exist before FY2023, accounted for S$63.1 million of FY2025 revenue.
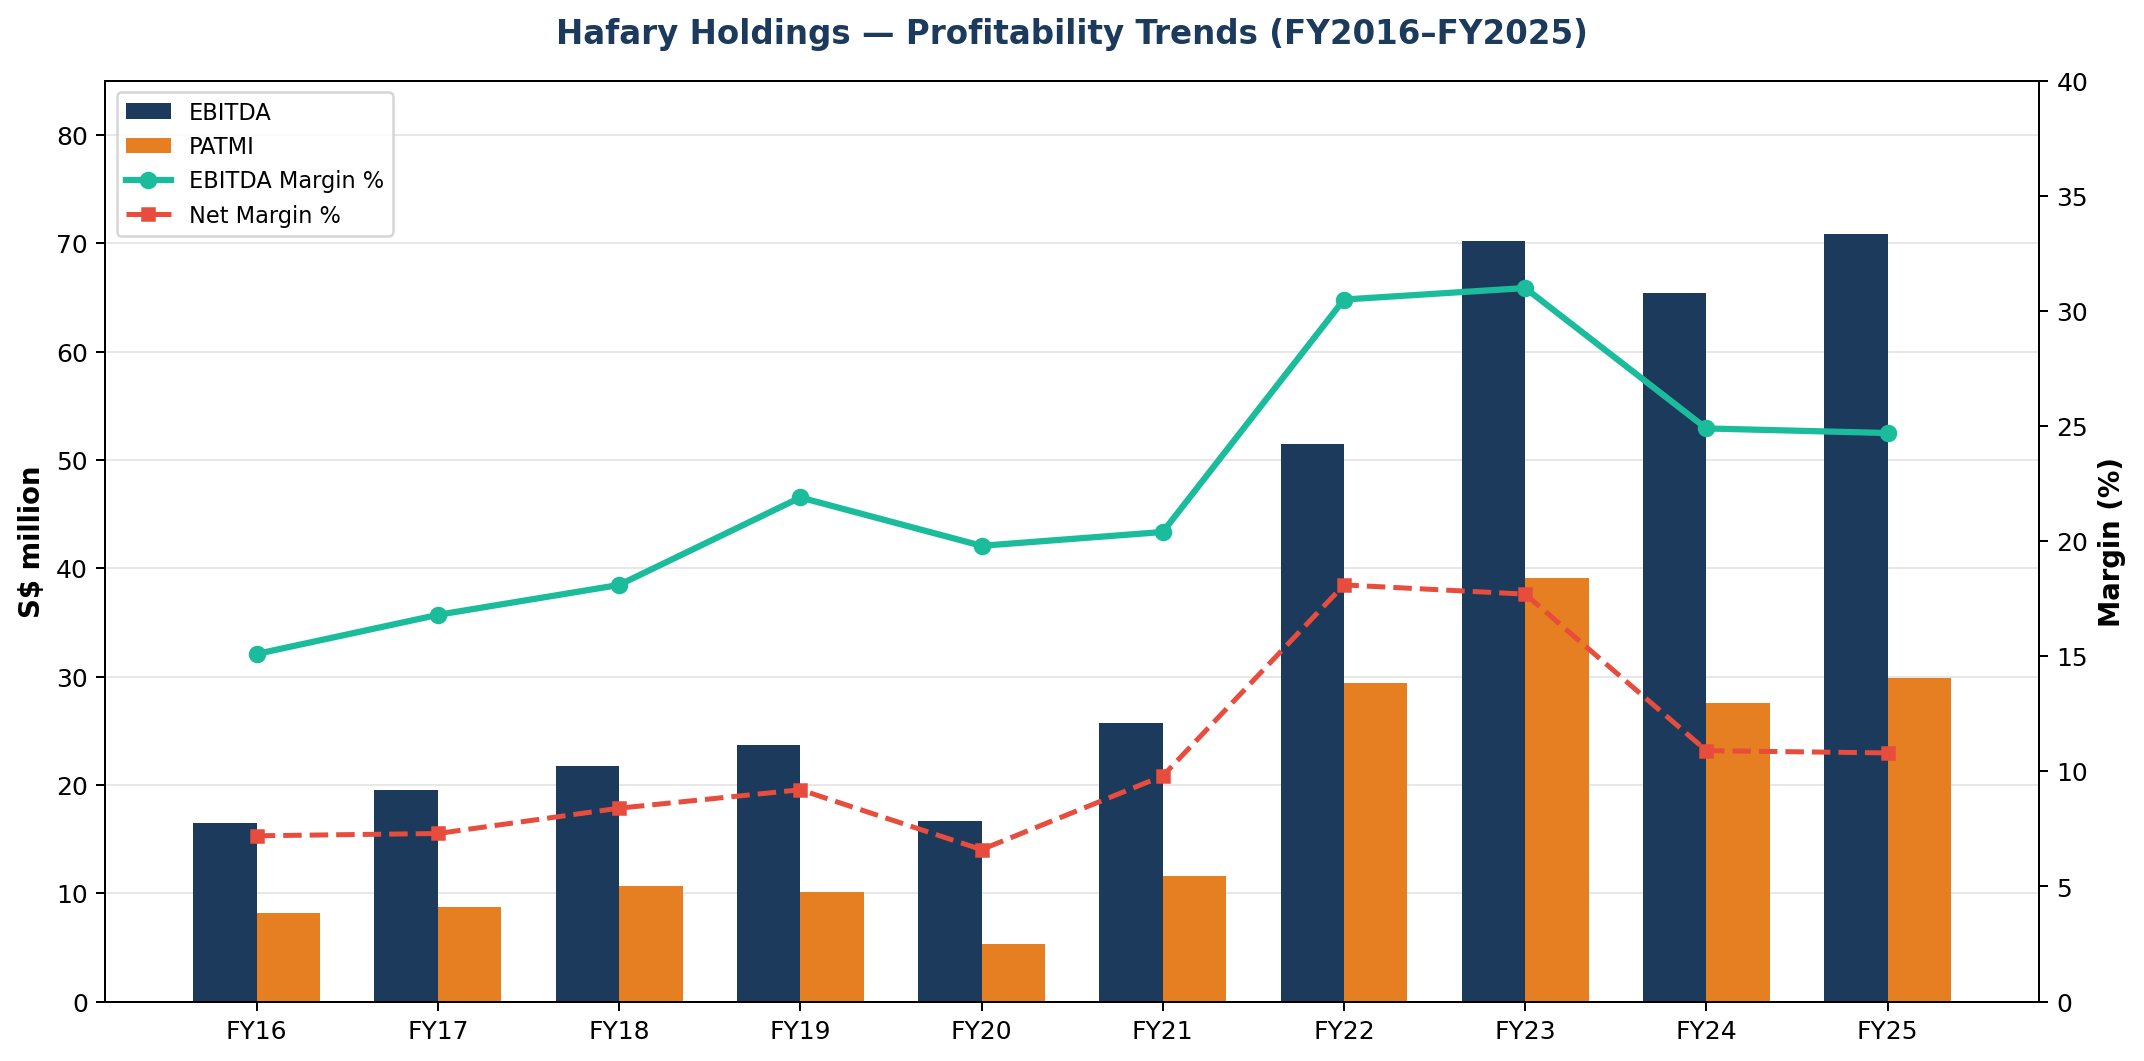
EBITDA expanded from S$16.5 million to S$70.9 million over the same period, with EBITDA margins improving from 15.1% to 24.7%. The margin improvement is notable: it suggests the business has operating leverage, and that the manufacturing segment (despite still being in ramp-up) has not diluted group profitability.
PATMI peaked at S$39.1 million in FY2023, driven by strong distribution margins and the initial ramp of manufacturing. FY2024 included a one-off gain of S$3.7 million on disposal of an investment property. FY2024 saw a normalisation to S$27.6 million before recovering to S$29.9 million in FY2025.
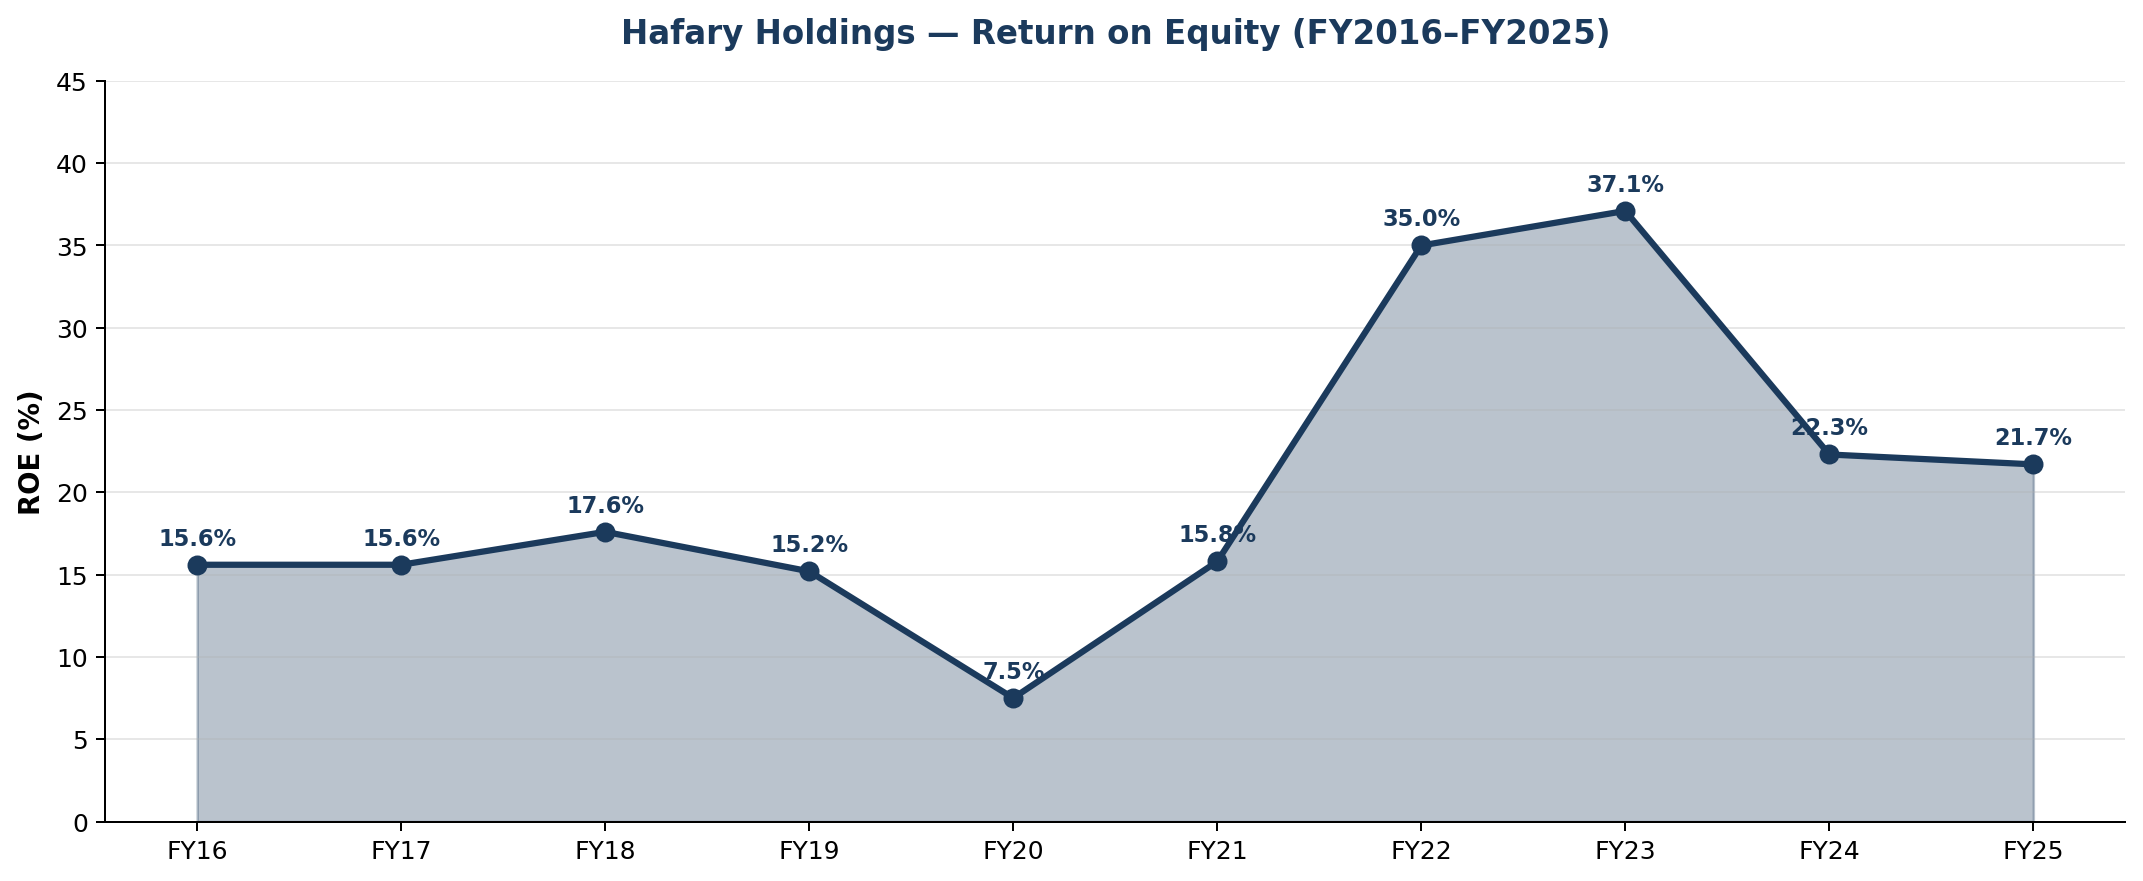
ROE has been consistently strong, averaging over 20% in recent years. FY2022 and FY2023 saw extraordinary ROE of 35% and 37% respectively, driven by profit growth on a still-modest equity base. FY2025 ROE of 21.7% remains well above cost of equity.
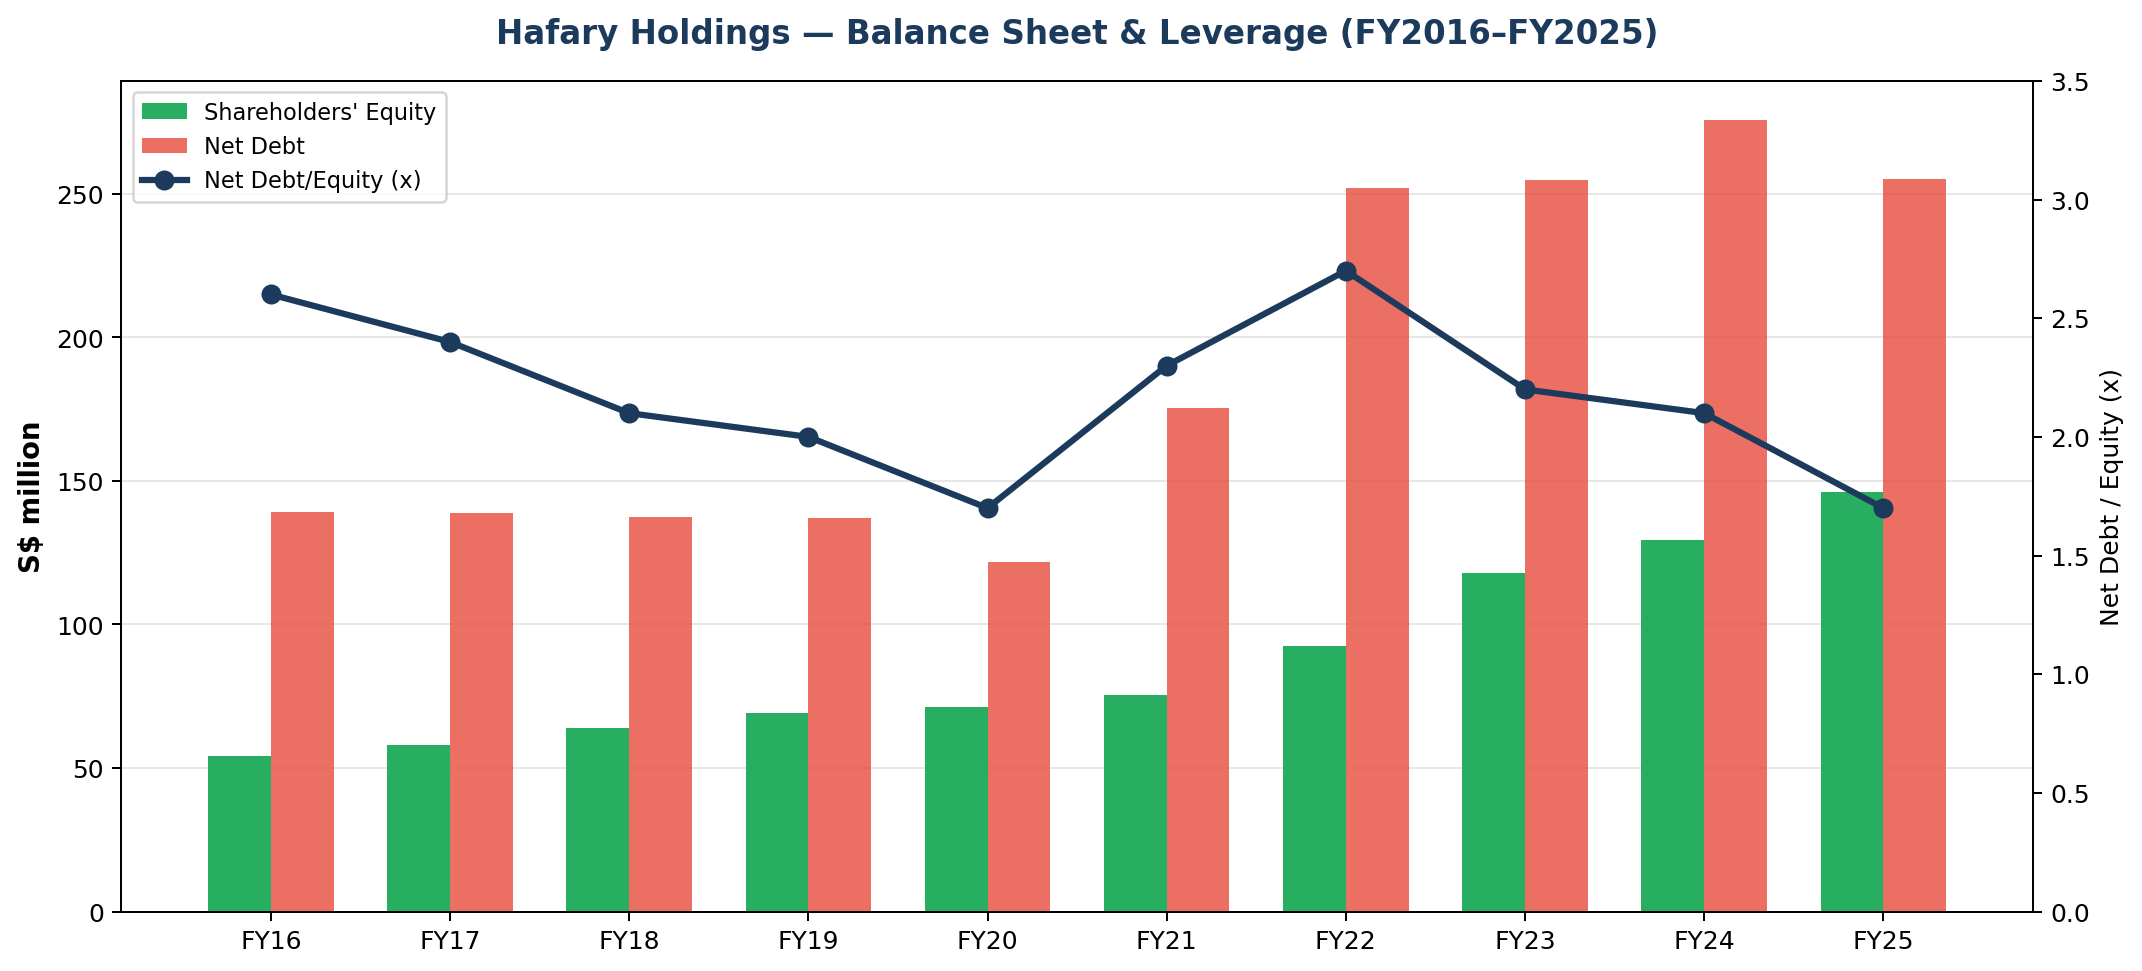
Balance sheet and leverage: Total assets have grown to S$509.8 million, driven by property acquisitions (161 Lavender Street, Sungei Kadut) and manufacturing capex. Net debt peaked at S$275.6 million in FY2024 and has since declined to S$255.1 million in FY2025. The net debt-to-equity ratio has improved from 2.7x in FY2022 to 1.7x in FY2025, still elevated but trending in the right direction. Interest cover stands at a comfortable 6.6x.
Operating cash flow was strong in FY2025 at S$57.9 million (vs S$22.6 million in FY2024), reflecting improved working capital management and higher profits.
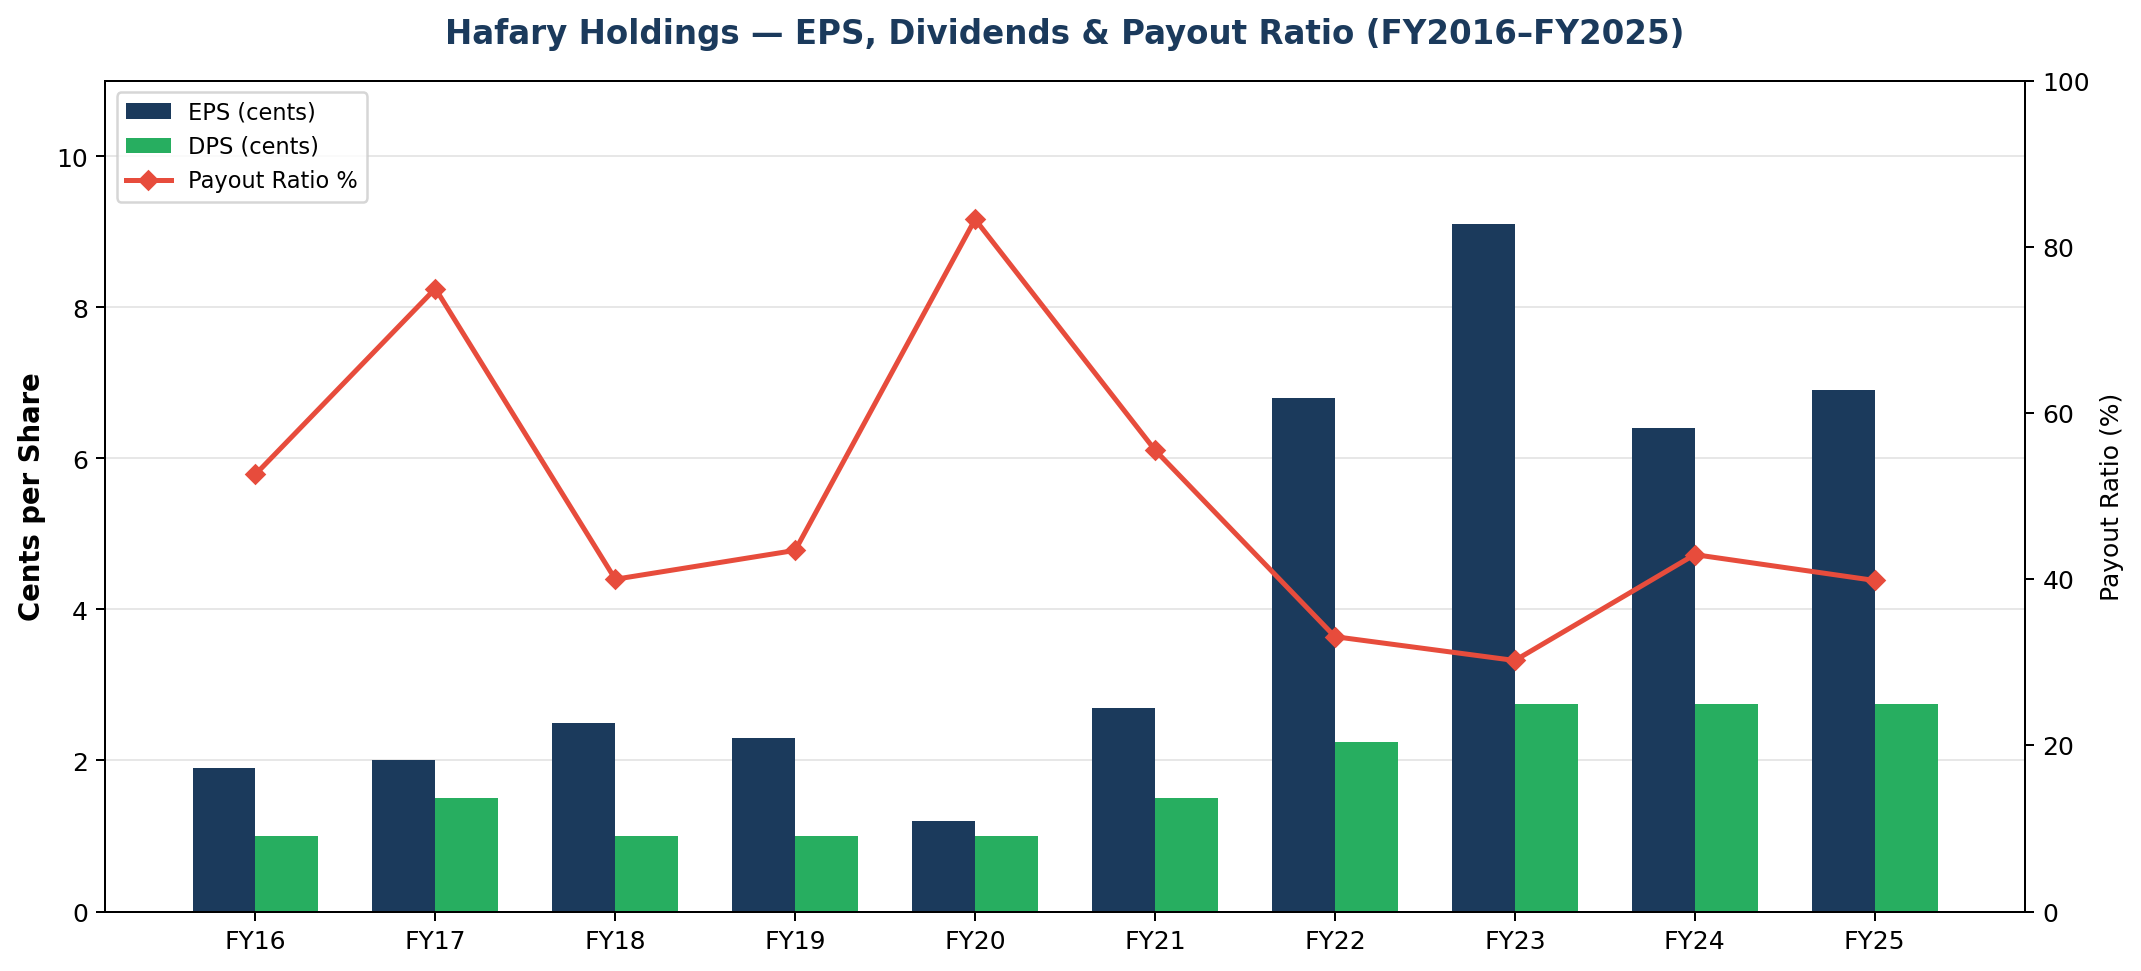
Dividends have been consistently paid and growing. DPS increased from 1.0 cent in FY2016 to 2.75 cents in FY2025, with the current yield at approximately 5.5%. The payout ratio has moderated from over 50% in earlier years to around 40% in FY2025, suggesting room for further increases as earnings grow.
Key Growth Drivers (Next 3–5 Years)
1. Manufacturing segment reaching profitability. The segment has grown from zero to S$63 million in revenue in just over two years but is still moving towards breakeven at the operating level. Analysts expect breakeven by FY2026. If manufacturing achieves a 10–15% operating margin at scale, it could add S$6–10 million in incremental profit to the group.
2. Singapore construction supercycle. With S$43–53 billion in annual construction demand projected by BCA through 2030, Hafary’s core distribution business has a multi-year tailwind. Terminal 5, Tuas Port, MBS IR2, and ongoing HDB BTO provide sustained downstream demand for tiles and surfacing materials.
3. US and international export growth. US revenue grew from near zero to S$35.7 million in FY2025, driven by manufactured tile exports from Malaysia. If US construction demand holds and Hafary expands its distribution network, this could become a meaningful profit contributor.
4. Malaysia as a dual platform. Malaysia serves both as a market (S$54.5 million in revenue) and a manufacturing base. Growth in Malaysian construction (forecast 6.1% in 2026) supports both sides.
5. ASEAN and China network maturing into profit contributors. The web of associates, JVs, and subsidiaries across Asia is no longer just a seeding exercise, it is generating real returns. The Vietnam associate contributed S$1.3 million in profit share, the Myanmar JV contributed S$0.8 million, and Indonesia is already a S$7.8 million revenue market. China revenue reached S$8.5 million with the MML Shanghai acquisition expanding the project sales base. If even a few of these markets scale to S$15–20 million in revenue each over the next 3–5 years, the group’s revenue base diversifies meaningfully beyond its Singapore-Malaysia-US core, reducing concentration risk and opening new profit pools.
6. Property asset monetisation. The 161 Lavender Street and Sungei Kadut properties (combined ~S$143 million in acquisition/valuation) are carried at cost on the balance sheet. Any revaluation, partial divestment, or yield enhancement from Hafary House operations could unlock value.
Major Risks and Bear Case Scenarios
Leverage remains elevated. Net debt of S$255 million against shareholders’ equity of S$146 million (1.7x) is manageable but leaves limited room for error. A significant downturn in construction activity or a rise in interest rates could squeeze cash flows. Borrowing rates currently range from 1.5% to 5.4%.
Manufacturing execution risk. The segment is not yet profitable at the operating level. If production quality issues arise, demand softens, or US trade policy changes (tariffs on Malaysian exports), the manufacturing bet could become a drag on returns.
Customer and revenue concentration in Singapore. Despite geographic diversification, Singapore still accounts for 60% of revenue. A sharp construction downturn in Singapore would hit the core business hard.
Inventory and working capital intensity. Inventories stood at S$124 million at FY2025 year-end (266 days of turnover). This is characteristic of the business but ties up significant capital and creates impairment risk if demand weakens.
Key man risk. Founder-CEO Low Kok Ann has led the business since 1980. Succession planning and management depth beyond the founding family are important considerations.
Thin trading liquidity. Average daily volume of ~20,860 shares means institutional investors may struggle to build or exit positions. This limits the re-rating potential in the near term.
Management Quality and Capital Allocation
Understanding Hafary’s management requires understanding the 2015 ownership transition because it fundamentally reshaped who runs the company and why.
Before 2015: a family business. Low Kok Ann founded Hafary in 1980 and built it into Singapore’s leading tile distributor over three decades. By 2014, the Low family collectively controlled about 54% of the company: Low Kok Ann held 15.85%, his son Low See Ching (then CEO) held ~28.7% through direct and nominee accounts, and daughter Dr Low Bee Lan Audrey held 9.58%. Property developer Ching Chiat Kwong (co-founder of Oxley Holdings) held ~19%. It was, in every sense, a founder-led, family-run business.
The 2015 Hap Seng deal: trading control for scale. On 31 December 2014, Malaysia-listed Hap Seng Consolidated Berhad announced a voluntary partial cash offer to acquire 51% of Hafary at S$0.24 per share, a total consideration of S$52.5 million. The Low family and Ching Chiat Kwong gave irrevocable undertakings to accept, collectively selling down their stakes to make room for Hap Seng’s 51% block. The deal closed in early 2015. Low See Ching had already stepped down as CEO and been redesignated as Non-Independent Non-Executive Director in January 2014, with his father Low Kok Ann taking over as CEO.
The logic was strategic. Hap Seng’s building materials arm, anchored by Malaysian Mosaics Sdn Bhd (MMSB), a tile manufacturer since 1964, was upstream (manufacturing). Hafary was downstream (distribution) with dominant Singapore market share. The combination created an integrated building materials platform. The Low family gave up majority control but retained significant skin in the game and kept operational leadership. They traded control for access to Hap Seng’s manufacturing infrastructure, capital, and regional network.
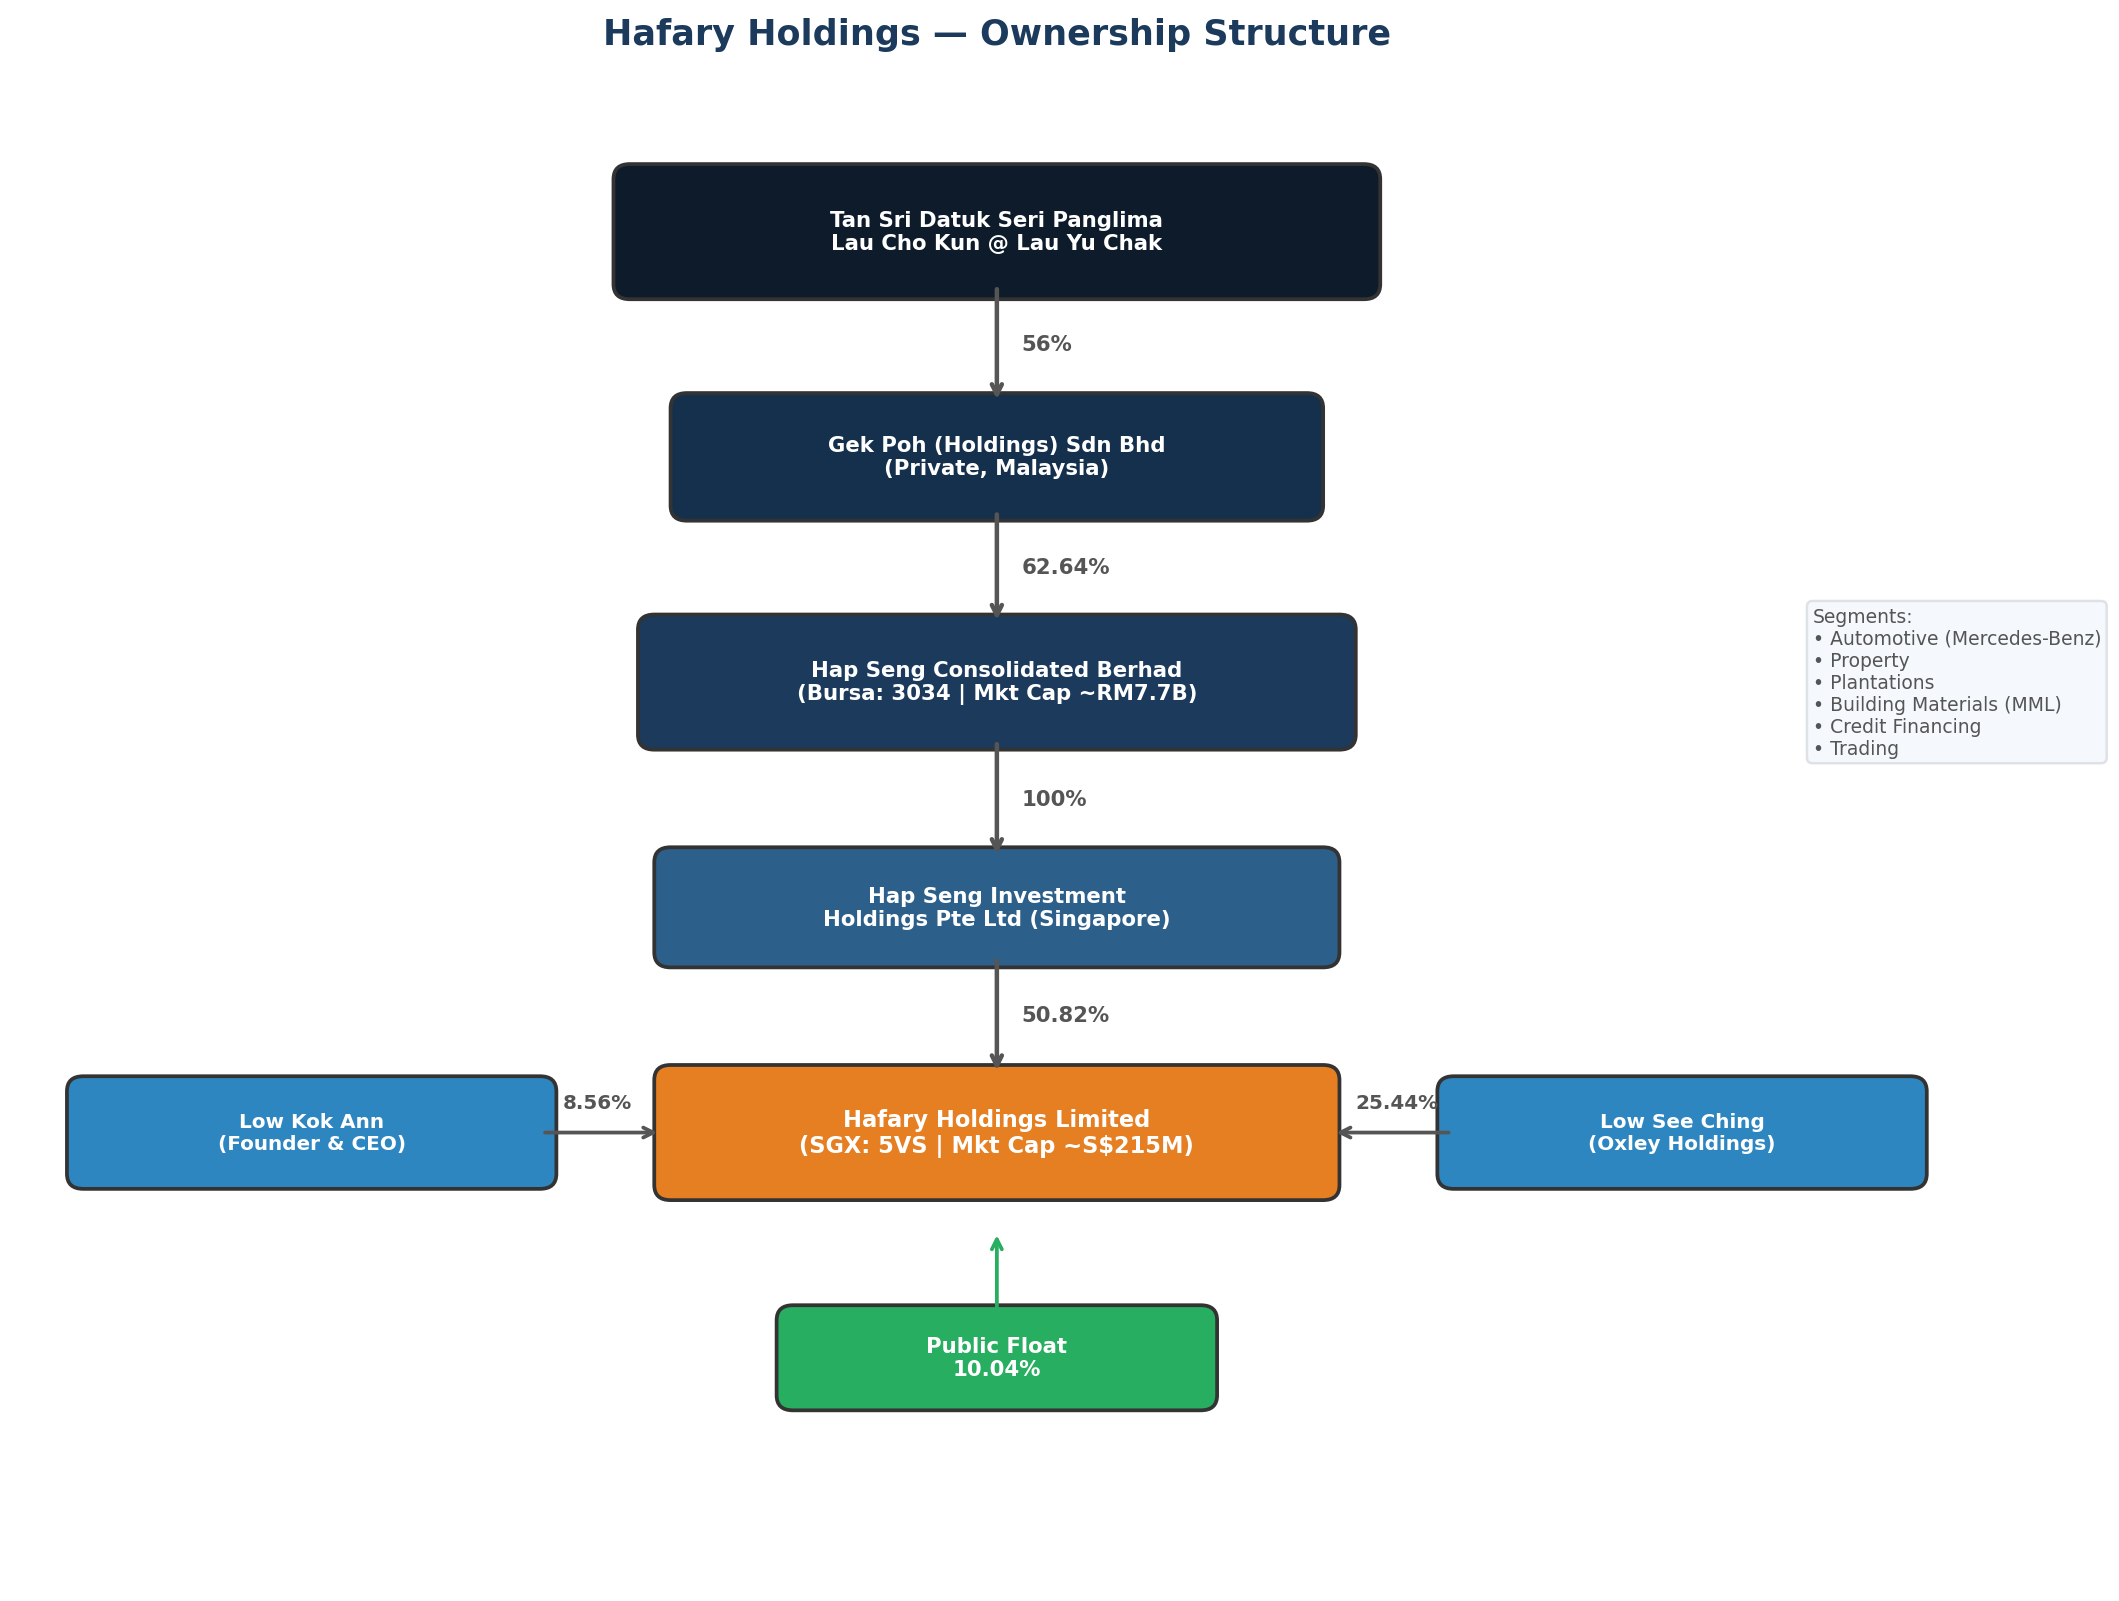
Today: a dual-power structure. The company is effectively co-governed by two forces. Hap Seng holds 50.82% and provides two board seats (Datuk Edward Lee Ming Foo and Cheah Yee Leng, both appointed March 2015), manufacturing know-how through MMSB, corporate management services, and access to regional networks. The Low family holds ~39.1% combined (Low Kok Ann 8.56%, Low See Ching 25.44%, Low Bee Lan Audrey 5.14%) and provides the operational leadership; Low Kok Ann remains CEO, with a seasoned operational team built over decades in the tile industry.
This is not a typical parent-subsidiary relationship where the controlling shareholder dictates strategy. The founder is still CEO, his family still holds 39% and is deeply embedded in operations. But Hap Seng’s majority stake means they have the votes on any matter that goes to shareholders. The alignment has worked well so far, revenue has tripled and the manufacturing segment would not exist without it, but it is an unusual governance structure that depends on continued alignment between the Lau family (Hap Seng’s ultimate controllers) and the Low family.
Capital allocation has been aggressive but largely sound. The 161 Lavender Street acquisition (S$71.3 million) was a bold move that gave Hafary both a flagship showroom and a heritage property asset. The manufacturing push into Malaysia required significant capex but is now generating S$63 million in revenue and approaching breakeven. Dividend policy has been consistent: the company has paid dividends every year through the cycle, including during COVID, and has progressively increased DPS from 1.0 cent to 2.75 cents.
Recent governance improvements include the appointment of two new independent directors in July 2024 and a new CFO, strengthening the independent voice on a seven-member board that otherwise has two Hap Seng representatives and two Low family-linked directors.
The Hap Seng Connection: Parent Company, Partner, and Platform
Hap Seng Consolidated Berhad (Bursa: 3034) is a Malaysian conglomerate with a market cap of approximately RM 7.3 billion (~S$2.1 billion), operating across six segments: automotive (one of Southeast Asia’s largest Mercedes-Benz dealers), property development, plantations (oil palm), credit financing, trading (fertilizers and agro-chemicals), and building materials. Per public market data, it reported revenue of RM 5.63 billion and net profit of RM 650 million in FY2024.
The building materials connection runs deep. Hap Seng’s building materials arm includes Malaysian Mosaics Sdn Bhd (”MMSB”), one of Malaysia’s oldest ceramic tile manufacturers, founded in 1964, with products sold in over 50 countries under the MML brand. MMSB operates three production facilities in Johor, the same state where Hafary’s own manufacturing operations are based. This is not a coincidence. Notably, Hap Seng recently reorganised its ceramic tiles business under MMSB to the Building Materials Division under Hafary Holdings, a signal that Hafary is becoming the group’s primary building materials platform rather than just a subsidiary. Hafary’s rapid scaling of its manufacturing segment, from zero to S$63 million in revenue in just over two years, would have been far more difficult without access to MMSB’s six decades of production know-how, established facilities, and distribution infrastructure.
The interested person transaction disclosures reveal the breadth of commercial dealings between the two groups:

Total interested person transactions with the Hap Seng group amounted to S$7.5 million in FY2025 (down from S$20.1 million in FY2024, when tile purchases from MMSB were significantly higher at S$12.3 million). The FY2025 figures include a notable one-off: the S$2.8 million acquisition of MML Shanghai Trading Co., Ltd. from MMSB, which expanded Hafary’s project revenue base in China.
Beyond the Hap Seng relationship, there is also a secondary network of interested person transactions linked to director Low See Ching, including rental income from The Assembly Place Holdings (S$207K), property management fees to TAP Co-livings (S$336K), and the earlier S$4.5 million acquisition of the remaining 19% stake in World Furnishing Hub from Low See Ching in FY2024.
Governance considerations. With 50.82% control and only 10.04% of shares in public hands, minority shareholders have limited influence over strategic decisions. The interested person transactions, while disclosed and conducted under shareholders’ mandate, require ongoing scrutiny to ensure arm’s-length pricing. The presence of two Hap Seng representatives on a seven-member board concentrates influence. Investors should satisfy themselves that the governance framework, including the three independent directors and the Audit Committee’s oversight of IPTs, provides adequate safeguards.
An Alternative Route: Hap Seng vs Hafary as an Investment
An investor interested in Hafary’s building materials story might reasonably ask: should I buy the subsidiary directly, or buy the parent at a conglomerate discount?
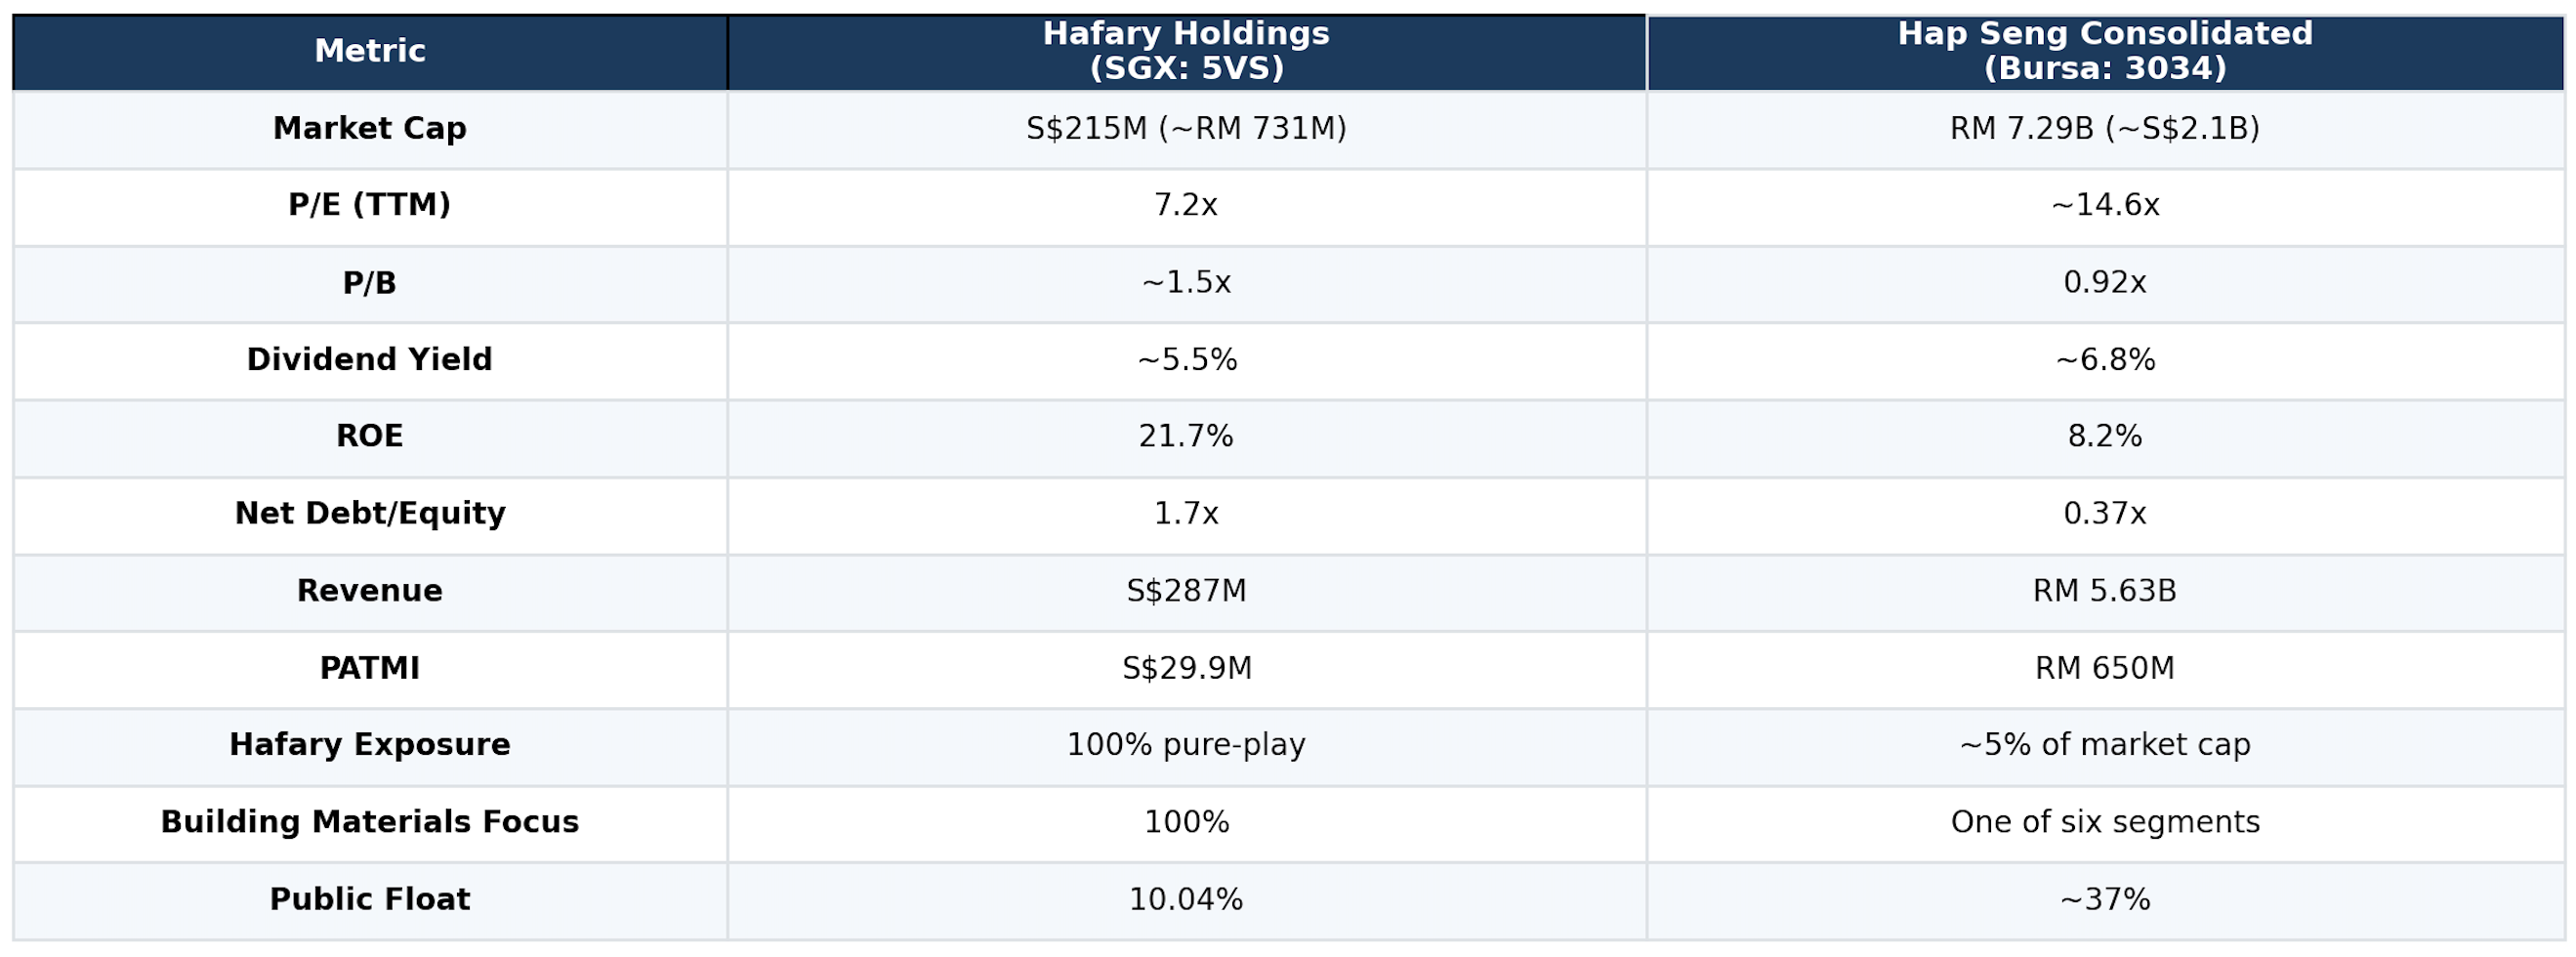
The numbers reveal a clear trade-off. Hap Seng trades at 0.92x book value, a discount to its RM 3.19 NTA per share, with lower leverage (0.37x net debt/equity vs Hafary’s 1.7x) and a higher dividend yield (~6.8% vs ~5.5%). It is a more conservative, diversified holding. But its ROE is a modest 8.2%, its earnings have been declining (PATMI fell from RM 951 million in FY2022 to RM 650 million in FY2024), and its revenue has contracted for two consecutive years.
Hafary, by contrast, is a higher-octane bet: 21.7% ROE, 11.3% revenue CAGR over the past decade, and a clear growth trajectory from its manufacturing expansion. But it comes with higher leverage and a much thinner public float.
The critical exposure question: Hap Seng’s 50.82% stake in Hafary is worth approximately S$109 million (RM 371 million) at current market prices, just 5.1% of Hap Seng’s RM 7.3 billion market cap. Buying Hap Seng gives you a small slice of Hafary diluted across Mercedes-Benz dealerships, palm oil plantations, property development, and fertilizer trading. Buying Hafary gives you 100% pure-play building materials exposure to Singapore’s construction supercycle.
Neither is inherently better, they just serve different investment objectives. Hap Seng suits an investor seeking a diversified, income-generating Malaysian conglomerate trading below book value. Hafary suits an investor with conviction in the Singapore construction cycle and Hafary’s manufacturing pivot, willing to accept higher leverage and lower liquidity for concentrated upside.
Valuation
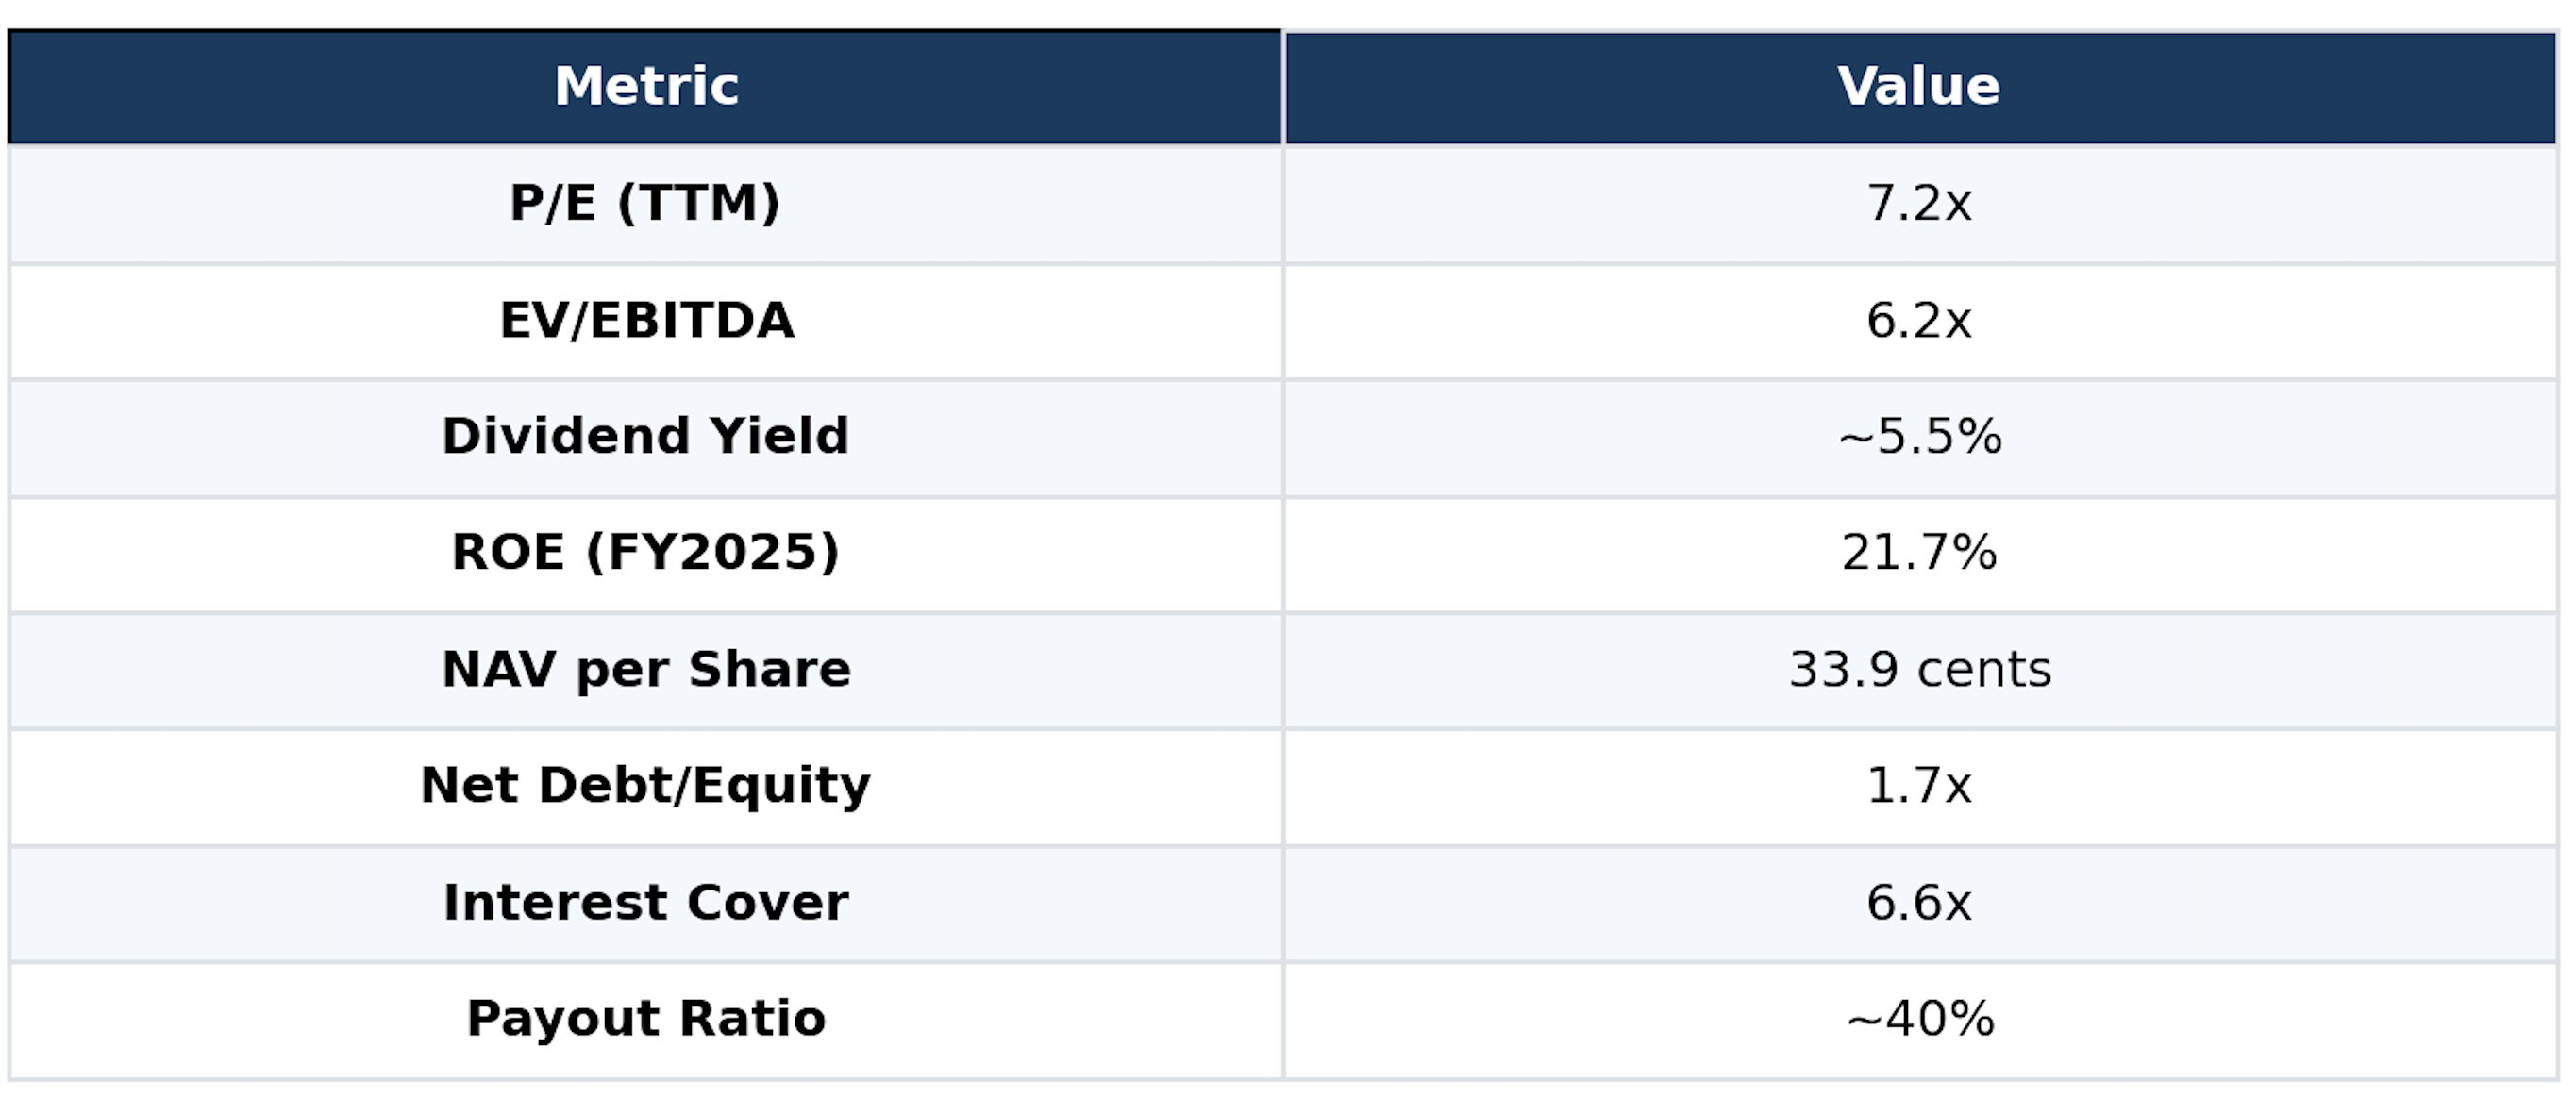
At S$0.50 per share, Hafary trades at 7.2x trailing P/E, approximately 6.6x EV/EBITDA (based on enterprise value of ~S$470 million and EBITDA of S$70.9 million), and 1.5x P/B (based on NAV of 33.9 cents per share). Dividend yield is approximately 5.5%.
These multiples are low relative to the broader Singapore construction sector. The discount likely reflects Hafary’s small-cap status, thin liquidity, the still-unproven manufacturing segment, and elevated leverage.
NAV perspective: NAV per share of 33.9 cents likely understates intrinsic value because key properties (161 Lavender Street, Sungei Kadut) are carried at historical cost. An independent valuation of the Sungei Kadut property alone was S$72 million, suggesting meaningful embedded value not reflected in the book.
Earnings perspective: At current earnings levels, the multiple is undemanding. Investors should consider whether the manufacturing segment’s path to profitability and the construction supercycle justify a higher or lower multiple, and form their own view accordingly.
Recent Developments and Catalysts
The twelve months to April 2026 have been eventful and the market has started to take notice. Hafary’s share price has risen approximately 49% over the past year, from a 52-week low of S$0.32 to trade around S$0.50, though it remains well below the 52-week high of S$0.60.
FY2025 results (released February 2026) delivered across every metric that matters. Revenue grew 9.1% to S$287 million. Gross margins expanded from 40.3% to 41.1%, indicating that the revenue mix is improving, not just growing. Operating cash flow more than doubled, from S$22.6 million to S$57.9 million, the strongest in recent memory. Net debt declined by S$20.5 million to S$255.1 million, and finance costs fell 12% to S$10.7 million as bank loan interest rates eased. The balance sheet, which had been a persistent concern, is healing.
Hafary House officially opened in January 2025, a 10,000 square-foot luxury flagship showroom at 161 Lavender Street, following a S$3 million refurbishment of the conservation shophouse block. This is more than a showroom upgrade. It positions the Hafary brand in the premium residential segment, targeting GCB owners, high-end renovation projects, and architectural firms, a market where margins are higher and brand differentiation matters more. The ground floor houses F&B and commercial tenants, while upper floors are managed as co-living spaces by The Assembly Place, generating rental income from the property.
Hap Seng reorganised its ceramic tiles business under Hafary. In a structural move that signals Hafary’s growing importance within the group, Hap Seng transferred the Building Materials Division, including MMSB’s operations, to sit under Hafary Holdings rather than as a separate Hap Seng division. This consolidation positions Hafary as the group’s primary building materials platform across the region, not merely a downstream distributor. It also suggests Hap Seng views Hafary’s management as capable of running a larger, more integrated operation.
MML Shanghai was acquired and consolidated from January 2025, expanding Hafary’s project revenue base in China. The S$2.8 million acquisition from MMSB brought a ready-made sales entity that contributed to the 2.2% project segment revenue growth in FY2025, a modest start, but it establishes Hafary’s direct presence in China’s project market for the first time.
Board and management refreshment. Two new independent directors were appointed in July 2024: Darrell Lim (who also sits on the board of BRC Asia Limited (SGX: BEC), Singapore’s largest steel reinforcement supplier) and Lim Wah Fong (with over 20 years of capital markets experience as a research analyst and senior portfolio manager). A new CFO was also appointed. These moves strengthen the independent voice on a seven-member board and bring capital markets expertise at a time when the company could benefit from improved investor communication and coverage.
Macro tailwinds for SGX small/mid-caps. The Straits Times Index broke historical highs and crossed 5,000 during 2025, and as noted in Hafary’s own Chairman’s Statement, “capital market stakeholders are predicting further upside by the end of 2026.” The ongoing MAS EQDP capital injection programme and SGX’s Value Unlock initiative are channelling institutional attention towards under-covered small and mid-cap stocks, exactly the category Hafary falls into, with its S$215 million market cap, 10% public float, and minimal analyst coverage.
Bull vs Bear Investment Thesis
The Bull Case: Hafary is a dominant market leader in an essential, non-discretionary construction material, trading at undemanding multiples relative to peers. The manufacturing segment is inflecting towards profitability, which could add S$6–10 million in incremental profit. Singapore’s multi-year construction supercycle provides a long runway for the core distribution business. US export growth adds a new dimension. The breadth of the international network, profitable associates in Vietnam, a producing JV in Myanmar, established revenue streams in Indonesia (S$7.8 million), China (S$8.5 million), and a dozen other markets, means the company has multiple optionalities beyond its Singapore core. If even two or three of these markets scale meaningfully, the revenue base diversifies in ways the current valuation does not reflect. Property assets are undervalued on the balance sheet. Consistent dividend payments provide a meaningful yield while investors wait.
The Bear Case: Leverage is elevated and leaves limited cushion for a downturn. Manufacturing is unproven at scale and may struggle to achieve sustainable margins, particularly if US tariff policy shifts. Singapore construction demand could soften if mega-projects face delays or if the economy slows. The international expansion, while promising, also introduces execution complexity: managing subsidiaries, associates, and JVs across 15 countries requires management bandwidth and exposes the group to currency risk (the Vietnamese Dong weakened materially in FY2025, reducing the carrying value of the Vietnam associate by S$1.7 million), political risk (Myanmar remains unstable), and the challenge of maintaining quality and brand consistency across fragmented markets. Inventory of S$124 million represents significant impairment risk. Thin liquidity (10% public float, ~20,860 shares daily volume) means the stock could be volatile. CEO Low Kok Ann has led the business since 1980, succession planning is a genuine concern given the dual-power structure between the Hap Seng and Low families. The alignment between the Lau family (Hap Seng’s controllers) and the Low family has worked well so far, but any divergence in strategic priorities could create governance friction. And for investors used to more liquid, widely-held stocks, the concentrated ownership structure may be a structural deterrent.
Key Factors That Could Break the Thesis
On the bull side, watch for: manufacturing segment turning profitable (analysts expect breakeven by FY2026), sustained revenue growth above S$300 million, net debt-to-equity declining below 1.5x, Indonesia or China revenue crossing S$15 million (signalling a third pillar market is maturing), any property revaluation or strategic asset move, and increased analyst coverage or institutional interest.
On the bear side, watch for: construction demand falling below BCA forecasts, manufacturing margins remaining negative beyond the expected FY2026 breakeven, a spike in interest rates increasing finance costs materially (currently S$10.7 million), impairment charges on inventory or receivables, write-downs of international associates or JVs (particularly if Myanmar deteriorates or the Vietnam Dong continues weakening), and any regulatory or trade policy changes affecting Malaysian exports to the US.
Summary
Hafary Holdings has evolved from a single-product tile trader into a S$287 million revenue platform spanning distribution, project supply, and manufacturing across multiple geographies. The company’s 50–60% share of Singapore’s general consumer tile market, built over more than four decades, is a genuine competitive advantage, and one that is difficult to replicate.
The 2015 Hap Seng acquisition was the pivotal inflection point. It transformed a family-run distributor into the building materials arm of a RM 7.3 billion Malaysian conglomerate, giving Hafary access to manufacturing infrastructure, regional networks, and capital that it could not have built alone. The Low family’s decision to trade majority control for scale has, by the numbers, paid off handsomely: revenue has tripled, a new manufacturing segment has emerged, and the company is now exporting tiles to the US. But it also created an unusual governance structure, the original founder still running day-to-day operations, a Malaysian conglomerate holding 50.82%, and a public float of just 10%, that investors need to understand and be comfortable with.
The financial track record is strong: revenue has grown at an 11.3% CAGR over the past decade, EBITDA margins have expanded from 15% to nearly 25%, and ROE has consistently exceeded 20% in recent years. Dividends have been paid every year through the cycle, including during COVID.
The key question facing the business is whether the manufacturing segment, still approaching breakeven, can deliver on its promise of margin expansion and export-driven growth. If it does, Hafary’s earnings power steps up meaningfully. If it doesn’t, the company remains a well-run distributor with elevated leverage from its aggressive expansion phase.
On the macro side, Singapore’s multi-year construction supercycle provides a supportive backdrop, but this is not a risk-free tailwind: project delays, interest rate movements, and trade policy shifts all matter for a company with S$255 million in net debt.
For those considering the building materials theme but preferring a different risk profile, the parent company Hap Seng Consolidated offers a diversified alternative at 0.92x book value with lower leverage and a higher dividend yield, though with only ~5% exposure to Hafary’s story.
References
All financial data sourced from Hafary Holdings annual reports (FY2010–FY2025) and SGX announcements. Market data from public sources as of April 2026
¹ DBS Group Research, "From Backlog to Breakout," March 2026, https://www.dbs.com.sg/sme/aics/templatedata/article/generic/data/en/GR/032026/260302_insights_sg_construction.xml
² BCA Media Release, 22 January 2026, "Steady Construction Demand in 2026," https://www1.bca.gov.sg/resources/newsroom/steady-construction-demand-in-2026-as-singapore-steps-up-support-for-built-environment-firms-through-collaboration-and-innovation/
³ Hafary Holdings AR2025, Chairman and CEO Statement, p.14, citing BCA-REDAS Built Environment and Real Estate Prospects Seminar 2026.
⁴ Hafary Holdings AR2025, Chairman and CEO Statement, p.14.
⁵ Mordor Intelligence, "Singapore Construction Industry Report," https://www.mordorintelligence.com/industry-reports/singapore-construction-market; also cited in GlobeNewsWire, 23 February 2026.
IMPORTANT DISCLAIMERS
General Disclaimer: This article is published for informational and educational purposes only. It does not constitute financial advice, a recommendation, or a solicitation to buy, sell, or hold any securities. The views expressed are based on publicly available data from Hafari Holdings’ SGX filings and publicly accessible market data, and may not reflect the most current developments.
Not Licensed Financial Advice: The author is not a licensed financial adviser, and this publication is not issued by a holder of a Capital Markets Services Licence under the Securities and Futures Act 2001 of Singapore. This content does not fall within the definition of “financial advisory service” under the Financial Advisers Act 2001 of Singapore. Readers in Singapore should note that this content is exempt from the requirements of the Financial Advisers Act pursuant to Regulation 34 of the Financial Advisers Regulations, as it is published in a generally available publication.
MAS Compliance Notice: In accordance with the Monetary Authority of Singapore’s guidelines, this publication does not take into account the specific investment objectives, financial situation, or particular needs of any individual. Before making any investment decision, you should consult a licensed financial adviser who can provide advice tailored to your personal circumstances. Past performance of any security discussed herein is not indicative of future results.
No Warranty: While the data and analysis have been prepared in good faith from public sources believed to be reliable, no representation or warranty, express or implied, is made as to the accuracy, completeness, or timeliness of the information. The author accepts no liability for any loss arising from the use of this material.
Disclosure: The author may or may not hold positions in the securities discussed. No compensation has been received from any company mentioned in this article.