

All-Link Air & Sea Limited (SGX: ALK) reported its first results as a listed company on 11 September, for the six months to 30 June 2026 [1]. Revenue rose 38.2% to US$40.1 million. Profit attributable to owners fell 19.8% to US$2.3 million.
These are the year-on-year figures.
They answer a narrower question than they appear to, because the half being compared against, the six months to June 2025, is the half immediately before this company's revenue base was rebuilt.
Set the same figures against the half that actually preceded the period, the six months to December 2025, and the direction reverses. Revenue fell 11.0%. Gross profit fell 12.9%. Profit attributable to owners fell 32.1%.
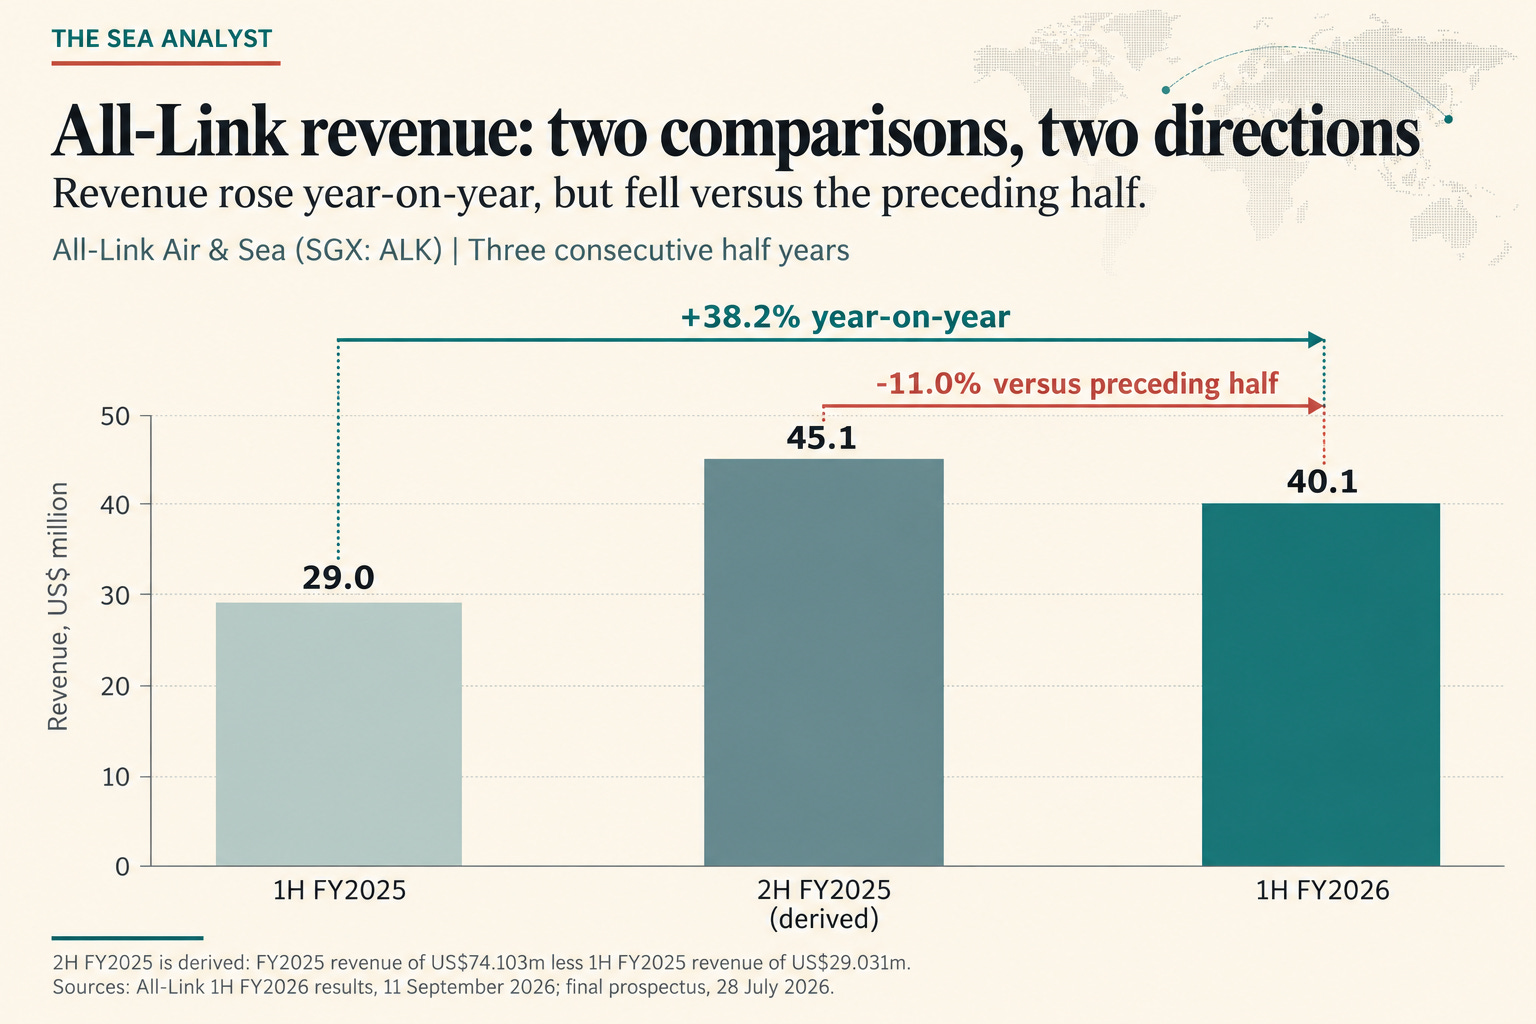
That comparison is available because the prospectus carries the audited full-year accounts on the same basis as the interim statements [2], so the second half of FY2025 can be derived by subtraction.
There is nothing wrong with the company leading on the year-on-year figures; the reporting rules ask for them. But the year is a strange stretch to measure across, because the customers changed almost entirely within it. US revenue fell from 70.5% of the total to 8.8%, Switzerland rose from 10.4% to 37.6%, and Hong Kong from nothing to 21.7%. Comparing the two ends of that is comparing two different customer bases. By the second half of FY2025 the new one had settled, so the December and June halves are the first that measure the same business twice.
The sequential comparison is not perfectly clean either. If the second half is genuinely the stronger season, then measuring a first half against a second half overstates the decline, and part of the 11.0% would be calendar rather than performance.
The filing also does not help to settle it. Its outlook says the Group "expects a stronger performance for the second half ended 31 December 2026 due to seasonality, that is higher shipment volumes during key festive periods in the fourth quarter" [1, page 20]. A note to the same statements, eleven pages earlier, says the Group's "businesses are not affected significantly by seasonal or cyclical factors during the financial periods" [1, page 9]. One document, filed on one day, points both ways, so how much of the 11.0% is seasonal it does not let anyone say.
Where the thesis stood
Our first look, published 30 July at the S$0.53 offer price, made several arguments. This half-year’s results let us test two of them directly. For the rest, we will need to wait for later periods.

The first was that the fifteen-fold revenue growth concealed falling profitability: gross margin dropped from 40.4% to 12.0% and profit to owners fell 25% from its FY2024 peak.
The second was that the revenue was not quite the company’s own, because roughly 90% of it arrived through customers referred by All-Link PRC, a China-based forwarder controlled by the husband of the controlling shareholder and expressly outside the listed group.
We put the offer at about 9.9 times trailing earnings, in line with size-matched regional forwarders rather than cheap, and at about 2.8 times book against a peer median just under 1.0. The closing line was that at close to ten times a falling earnings line, the market was being asked to pay for a transition that had only just begun.
One thing in that piece needs correcting before going further. We treated the shift away from American revenue as something that might or might not happen after the listing. It had already happened, and the prospectus disclosed it. We read the operating-geography table, which reports by the entity booking the revenue, and did not read the customer-location table in the audited accounts, which reports on the same basis as these interim statements. Had we read it, we would have seen Switzerland at US$24.9 million, 33.6% of FY2025 revenue, matching the 33.6% the prospectus attributes to Customer A. The transition was largely complete at the offer.
The numbers, on both comparisons
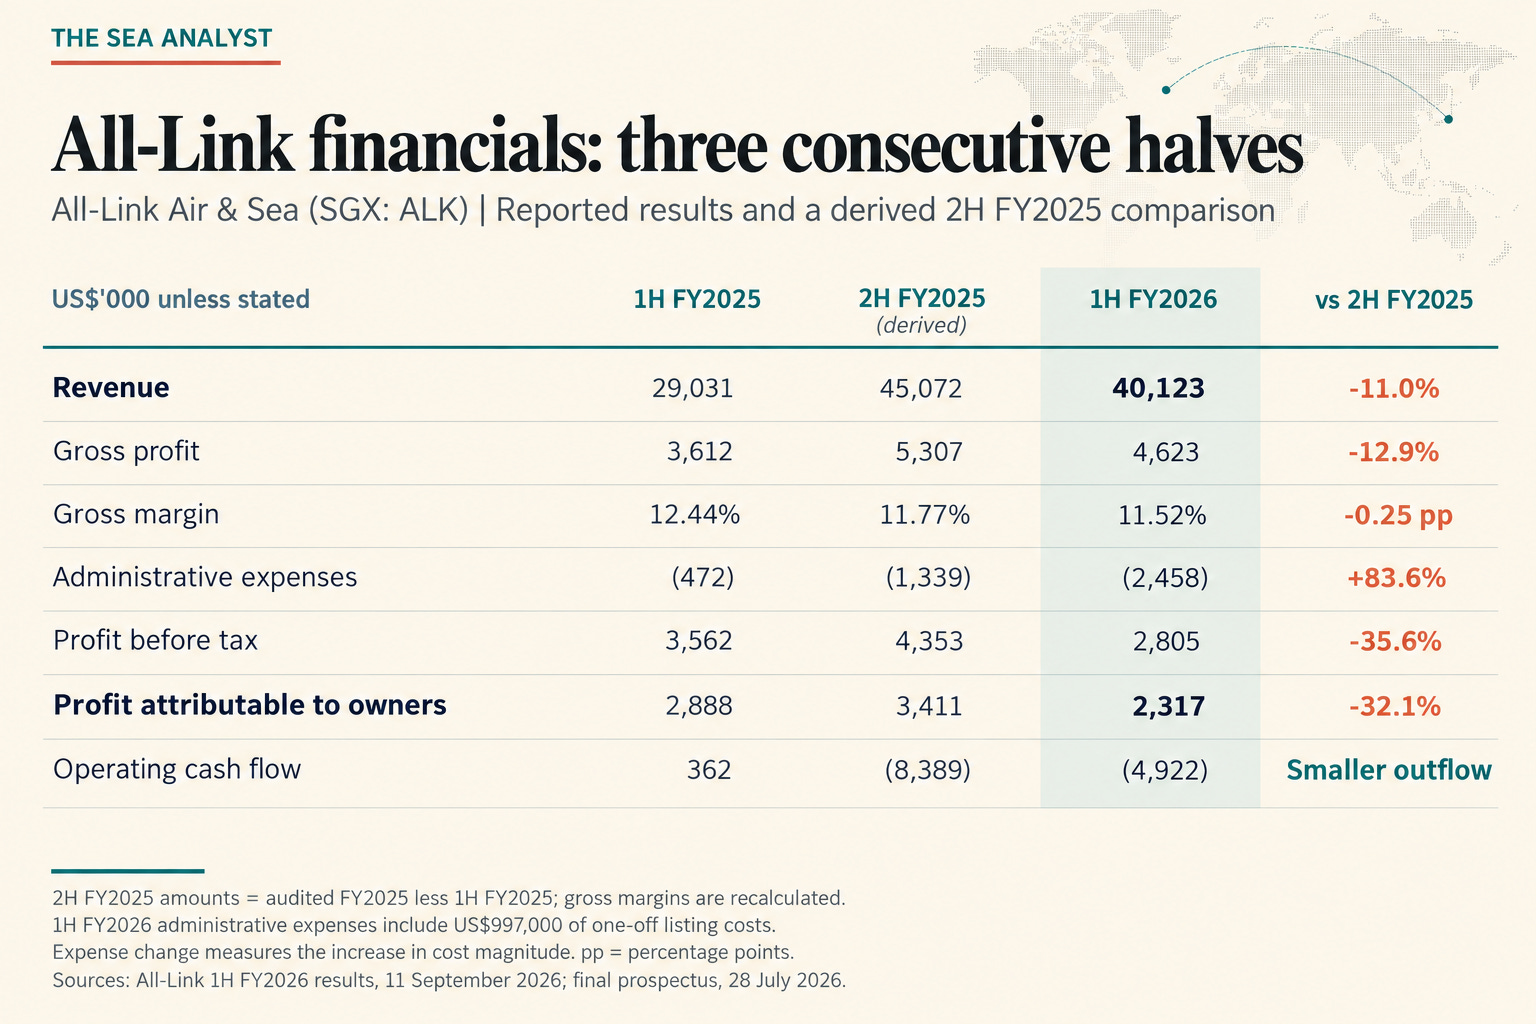
Gross margin is where the two comparisons disagree least: down 0.92 points on the year, 0.25 on the half, and now 11.52%, the lowest on record.
Below the gross line, profit fell far faster than revenue, because costs rose rather than fell: administrative expenses nearly doubled from the half before, from US$1.3 million to US$2.5 million, US$1.0 million of it one-off listing costs. That is why profit before tax fell 35.6% and profit to owners 32.1%, against a revenue fall of 11.0%.
The company’s adjustment strips the US$1.0 million of listing costs to reach adjusted profit of US$3.4 million, up 11.6% year on year. It leaves in a US$0.4 million gain on the MF Logistics earn-out, though, which its own results release calls a “non-operating gain” [7].
Strip both and profit is about US$3.0 million, roughly flat on the June 2025 half and about 16% below the December one. That last figure is rough rather than exact: the gain is disclosed pre-tax in note 6 [1], so netting it against a post-tax number mixes bases.
The segment note localises the damage, though only year-on-year: the three-segment split is new this period, so there is no December half to measure against, and these figures compare with 1H FY2025. Singapore segment profit before tax fell from US$3,165k a year earlier to US$1,756k, down 44.5%, while its revenue rose 27.5%. The Philippines segment grew profit from US$397k to US$562k. Malaysia contributed US$487k against no comparable figure, since that segment did not exist a year earlier.
The filing does not disclose how the US$1.0 million of listing expenses is allocated between segments, so some or all of it may sit in Singapore. Even attributing the entire amount there leaves about US$0.4 million of the Singapore decline unexplained.
What the guidance requires, and what the filing says about it
Management expects FY2026 revenue to exceed FY2025, attributing the expected stronger second half to heavier fourth-quarter festive volumes [1].
The revenue bar is low, though not automatic. FY2025 revenue was US$74.1 million and the half just reported was US$40.1 million, so the second half needs only about US$34.0 million to match it, roughly 15% below the half just delivered. Even a repeat of this half’s 11% fall would produce about US$35.7 million and still clear FY2025. A full-year increase is therefore better read as the expected outcome than as evidence of momentum.
It also revives the seasonality contradiction flagged earlier: the outlook leans on a stronger festive-quarter half, while the “Seasonal operations” note says the business is not significantly affected by seasonal factors [1, page 9]. The two need not strictly conflict, since the note concerns whether seasonality distorts the period presented while the outlook concerns whether the fourth quarter carries more volume than the rest of the year. Still, they are an odd pair, and a reader leaning on the guidance is entitled to ask which one management means.