
AI Named, Recovery Confirmed, Discount Unchanged
SGX:S71 update: KESM Q3FY2026 -- RM9.1m 9M PBT, AI chips named as demand driver, all thesis breakers clear, S71 down 16% since publication.

Three weeks after we published the Sunright initiation, the central operating thesis has been materially validated by the filing that matters most: KESM Industries Berhad’s Q3 FY2026 quarterly announcement, filed on 28 May 2026 for the quarter ended 30 April 2026. KESM swung from a RM8.4 million 9M loss to a RM9.1 million 9M profit before tax. Revenue grew 3% to RM161.3 million on what management, for the first time in a primary Bursa filing, explicitly attributed to “higher demand for the Group’s services in artificial intelligence (AI) related chips.” Capex tripled versus the prior year. None of the five thesis breakers fired.

Sunright’s own share price, meanwhile, has pulled back 15.6% from our 7 May 2026 publication close of S$0.895 to S$0.755 as of 30 May 2026. The operating asset improved. The price fell. The entry is better.
This note runs the data, checks the thesis breakers, refreshes the look-through valuation, and identifies what to watch next.
The numbers
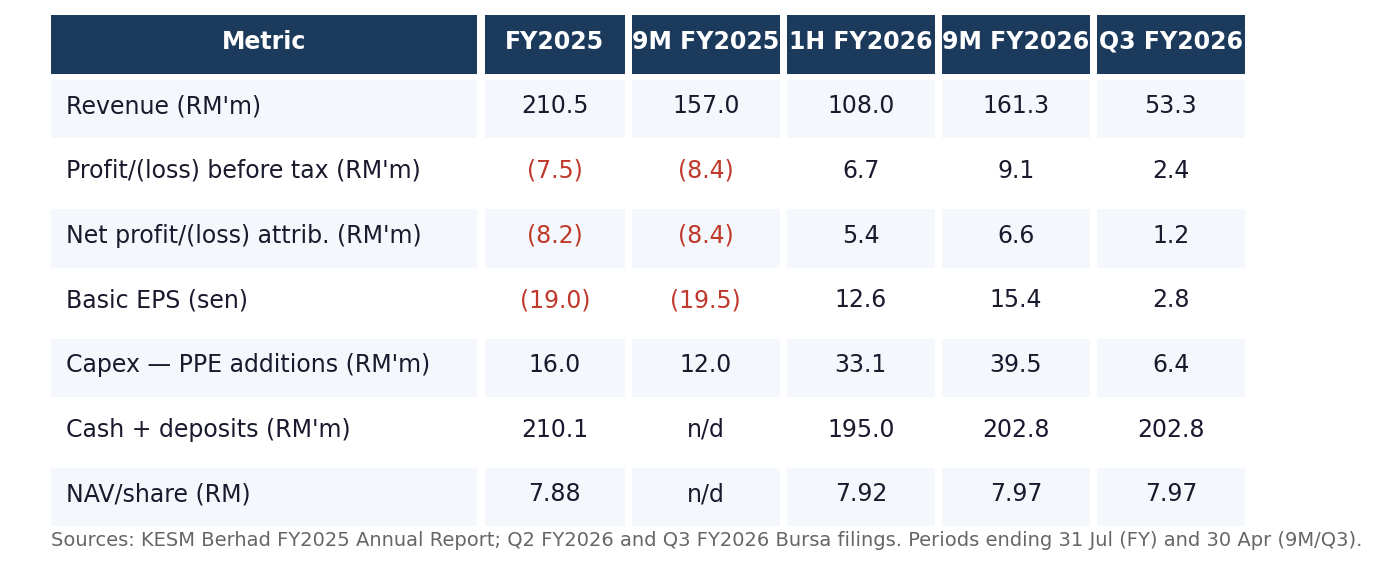
The 9M PBT swing, from a RM8.4 million loss to a RM9.1 million profit, is not a marginal result. It is a full-cycle reversal on three quarters of data, covering the most operationally intensive months of the fiscal year. Revenue growth of 3% to RM161.3 million is incremental rather than transformative, but the cost-structure improvement did the heavier lifting: other expenses declined 15% (RM8.9 million lower year-on-year) from cost reductions in utilities, repairs and maintenance, and lower fair-value losses on investment securities. Employee expense fell 3% or RM1.8 million. Depreciation rose 8% as newly commissioned machinery and test equipment entered service.
The sequential read is softer: Q3 profit before tax of RM2.4 million was below Q2’s RM4.1 million. Management attribute this to a RM2.3 million net fair-value loss on investment securities (the equity portfolio KESM holds on its balance sheet) and the absence of a RM0.8 million impairment reversal that boosted Q2. Revenue was flat quarter-on-quarter (RM53.3 million versus RM54.9 million). The operating business has not deteriorated; the sequential dip is non-operating noise from the investment portfolio and one-time items.
Thesis breaker check
Five watchlist triggers were established at the time of the initiation.
Two consecutive flat or negative-growth revenue quarters. Q3 revenue grew 1% year-on-year (RM53.3 million versus RM52.8 million). Q2 grew 7% year-on-year. Neither quarter is flat or negative. ✓
Full-year FY2026 KESM revenue below RM215 million. Nine months produced RM161.3 million. Q4 requires RM53.7 million to clear the threshold, in line with Q3’s RM53.3 million and requiring no acceleration. ✓ On track.
FY2026 attributable net profit below RM4 million. Nine months produced RM6.6 million attributable. This threshold is cleared for the full year absent a material Q4 impairment. ✓
Employee/revenue ratio above 44%. Nine-month employee expense of RM61.9 million against RM161.3 million revenue gives 38.4%. This is well below the 44% structural-labour trigger. Operating leverage is running in the right direction. ✓
Total FY2026 dividend substantially above 6 sen. The interim dividend of 6.0 sen per share was paid on 28 October 2025. No additional dividend was declared in Q3. ✓ Consistent with reinvestment thesis.
None of the five triggers fired. All are tracking in the expected direction.
What management said for the first time
In prior quarterly announcements, KESM management described demand improvements in general terms: volume growth, customer mix, utilisation trends. In Q3 FY2026, the filing uses specific language in both the individual quarter and year-to-date discussions: “primarily driven by higher demand for the Group’s services in artificial intelligence (AI) related chips.” This is the first explicit AI attribution in a primary Bursa filing.
For the look-through thesis on Sunright, this matters. The initiation framed KESM’s AI exposure as probabilistic: a plausible demand driver validated externally by Aehr Test Systems’ USD 41 million hyperscale win, but not yet confirmed by the operating entity’s own language. That confirmation has now arrived. The RM28.4 million of outstanding capex commitments, layered on top of the RM39.5 million already deployed in 9M, reflect management’s confidence that the demand is durable enough to justify a capacity build-out ahead of the revenue.
The prospects section of the filing adds context: worldwide semiconductor revenue is expected to exceed USD 1.3 trillion in 2026, up 64% from 2025, driven by AI processing, data centre networking and power, and memory price inflation. AI semiconductors are projected to account for nearly 30% of total semiconductor revenue. KESM’s customer introductions are described as “closely aligned” with this cycle.
Look-through and valuation refresh
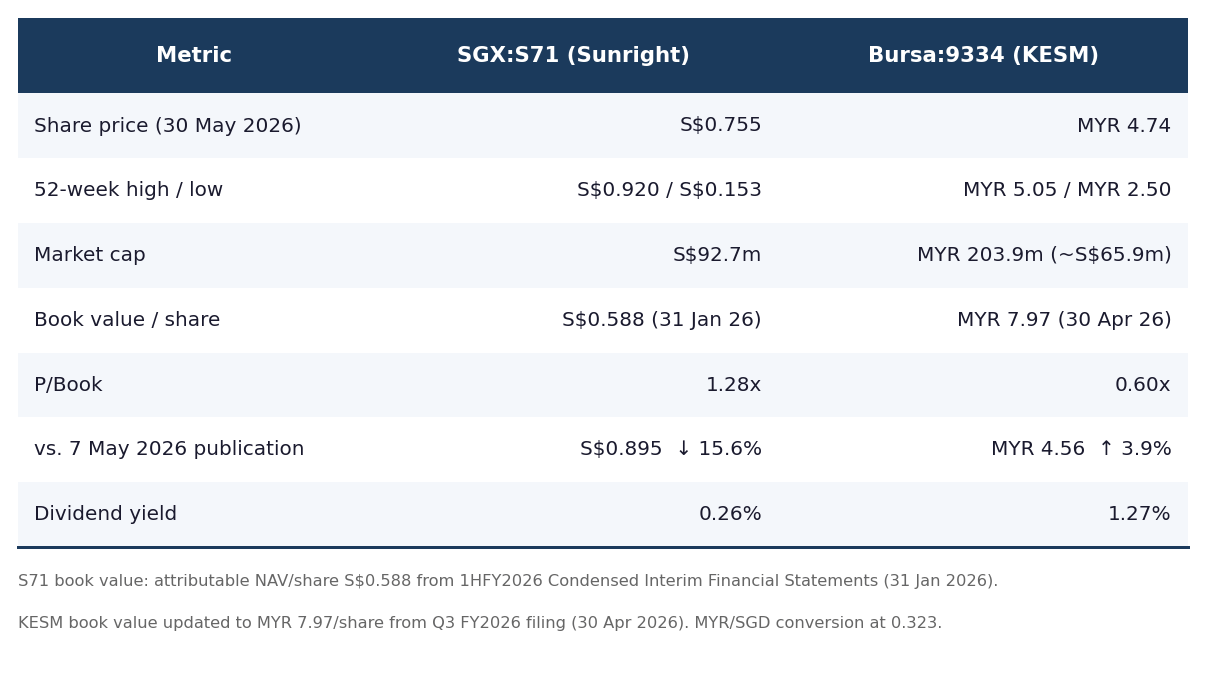
The headline compression since publication: S71 is down 15.6% while the operating entity improved. At publication, the core valuation tension was a 1.52x P/Attributable NAV on the SGX versus 0.58x P/Book on Bursa. That gap has narrowed modestly from the S71 side: the SGX multiple compressed to 1.28x as the price pulled back from near the 52-week high. The Bursa discount edged up marginally to 0.60x on slightly higher book value. The structure of the trade is unchanged: the KESM discount and the net cash floor are the same; the premium you pay for that optionality is lower.
The look-through decomposition at current prices: Sunright’s 48.41% KESM stake is worth S$31.9 million at Bursa market (versus S$30.7 million at publication). Subtract that from the S$92.7 million market cap and the implied value of Sunright’s Singapore parent entity (equipment manufacturing, management fees, and S$0.55/share in net cash) is S$60.8 million. The attributable book attributable to the non-KESM parent is roughly S$22 million. Implied ex-KESM P/Book: 2.74x, compressed from 3.6x at publication. The anomaly is smaller than it was; it persists.
The convergence-trade math: if KESM rerated to 1.0x book (MYR 7.97, +68% from MYR 4.74), Sunright’s KESM stake rises to S$53.6 million, a S$21.7 million uplift, or S$0.177 per Sunright share. At S$0.755, that delivers S$0.932, within range of the 52-week high. That scenario has not changed since the initiation; the book value it targets has grown, and the starting price is lower.
What to watch next
KESM Q4 FY2026 (estimated filing September 2026) is the confirmation quarter. If Q4 revenue holds at RM53 million or above, full-year FY2026 KESM revenue clears the RM215 million threshold. If PATMI holds near Q3’s quarterly rate, full-year attributable net profit will land around RM8 million, double the RM4 million minimum. The Q4 filing will also resolve whether a final dividend is declared for FY2026: any step-up above the 6 sen interim total would be the first dividend increase since FY2024.
Sunright FY2026 full-year results (estimated September–October 2026) will provide the consolidated picture: Sunright Singapore equipment revenue, intercompany management fees, and the attributable share of KESM’s full-year performance on one statement. That is the filing where the bull case (group revenue above S$90 million, attributable net profit above S$5 million) either clears or doesn’t.
Bottom line
KESM Q3 FY2026 is an operationally clean result: profitable through nine months, AI demand explicitly confirmed in primary filing language, capex tripled with capacity commitments signalling confidence in forward volume, and all five thesis breakers untriggered. S71 at S$0.755 offers the same structural optionality as the initiation, with the SGX/Bursa multiple gap intact and the net cash floor at S$0.55/share, at a meaningfully lower premium. The sequential Q3 dip was non-operating; the operating business is holding. The Q4 KESM result in September is the next binary.
Data integrity notes
Sunright’s latest published filing is the 1HFY2026 Condensed Interim Financial Statements (31 January 2026). The attributable NAV/share of S$0.588 used in the valuation table reflects that filing. KESM book value is updated to the Q3 FY2026 figure (30 April 2026). There is a one-quarter timing mismatch between the two book values; it is immaterial to the analysis.
FY2025 full-year KESM capex (RM16.0 million) is sourced from the KESM FY2025 Annual Report cash flow statement.
MYR/SGD conversion at 0.323 throughout, consistent with the published initiation. Exchange rate fluctuations affect the look-through valuation arithmetic; this rate has been stable in the RM3.09–3.10/S$1 range in the period since publication.
References
[1] KESM Industries Berhad, “Unaudited Third Quarterly Report on Consolidated Results for the Financial Quarter Ended 30 April 2026”, Bursa Malaysia filing, 28 May 2026.
[2] KESM Industries Berhad, “Unaudited Second Quarterly Report on Consolidated Results for the Financial Quarter Ended 31 January 2026”, Bursa Malaysia filing, 10 March 2026.
[3] Sunright Limited, “Condensed Interim Financial Statements and Dividend Announcement for the Half-Year Ended 31 January 2026”, SGX filing, 13 March 2026.
[4] Sunright (S71.SI) and KESM Industries Berhad (9334.KL), share price and market data via Yahoo Finance, retrieved 30 May 2026. https://finance.yahoo.com/quote/S71.SI / https://finance.yahoo.com/quote/9334.KL
IMPORTANT DISCLAIMERS
This article is published for informational and educational purposes only. It does not constitute financial or investment advice, a recommendation, or a solicitation to buy, sell, or hold any securities. The author is not a licensed financial adviser under the Financial Advisers Act 2001 of Singapore, nor a licensed adviser under the Capital Markets and Services Act 2007 of Malaysia. This content is exempt from the requirements of the Singapore Financial Advisers Act pursuant to Regulation 34 of the Financial Advisers Regulations, as it is published in a generally available publication. This publication does not take into account the specific investment objectives, financial situation, or particular needs of any individual. Before making any investment decision, readers should consult a licensed financial or investment adviser in their relevant jurisdiction. Past performance is not indicative of future results.
No Warranty: While the data and analysis have been prepared in good faith from public sources believed to be reliable, no representation or warranty, express or implied, is made as to the accuracy, completeness, or timeliness of the information. The author accepts no liability for any loss arising from the use of this material.
Disclosure: The author holds no position in the securities discussed and has not traded in them in the 30 days prior to publication, unless otherwise stated. This publication has received no compensation from any company discussed, or any related party.