
Sunright's AI Turnaround Is Real. Its Premium Isn't.
Sunright (SGX:S71): a holding-company arithmetic problem hiding behind a near-5x twelve-month rally.

Short-form deep dive, distilled analysis, ~15 mins read
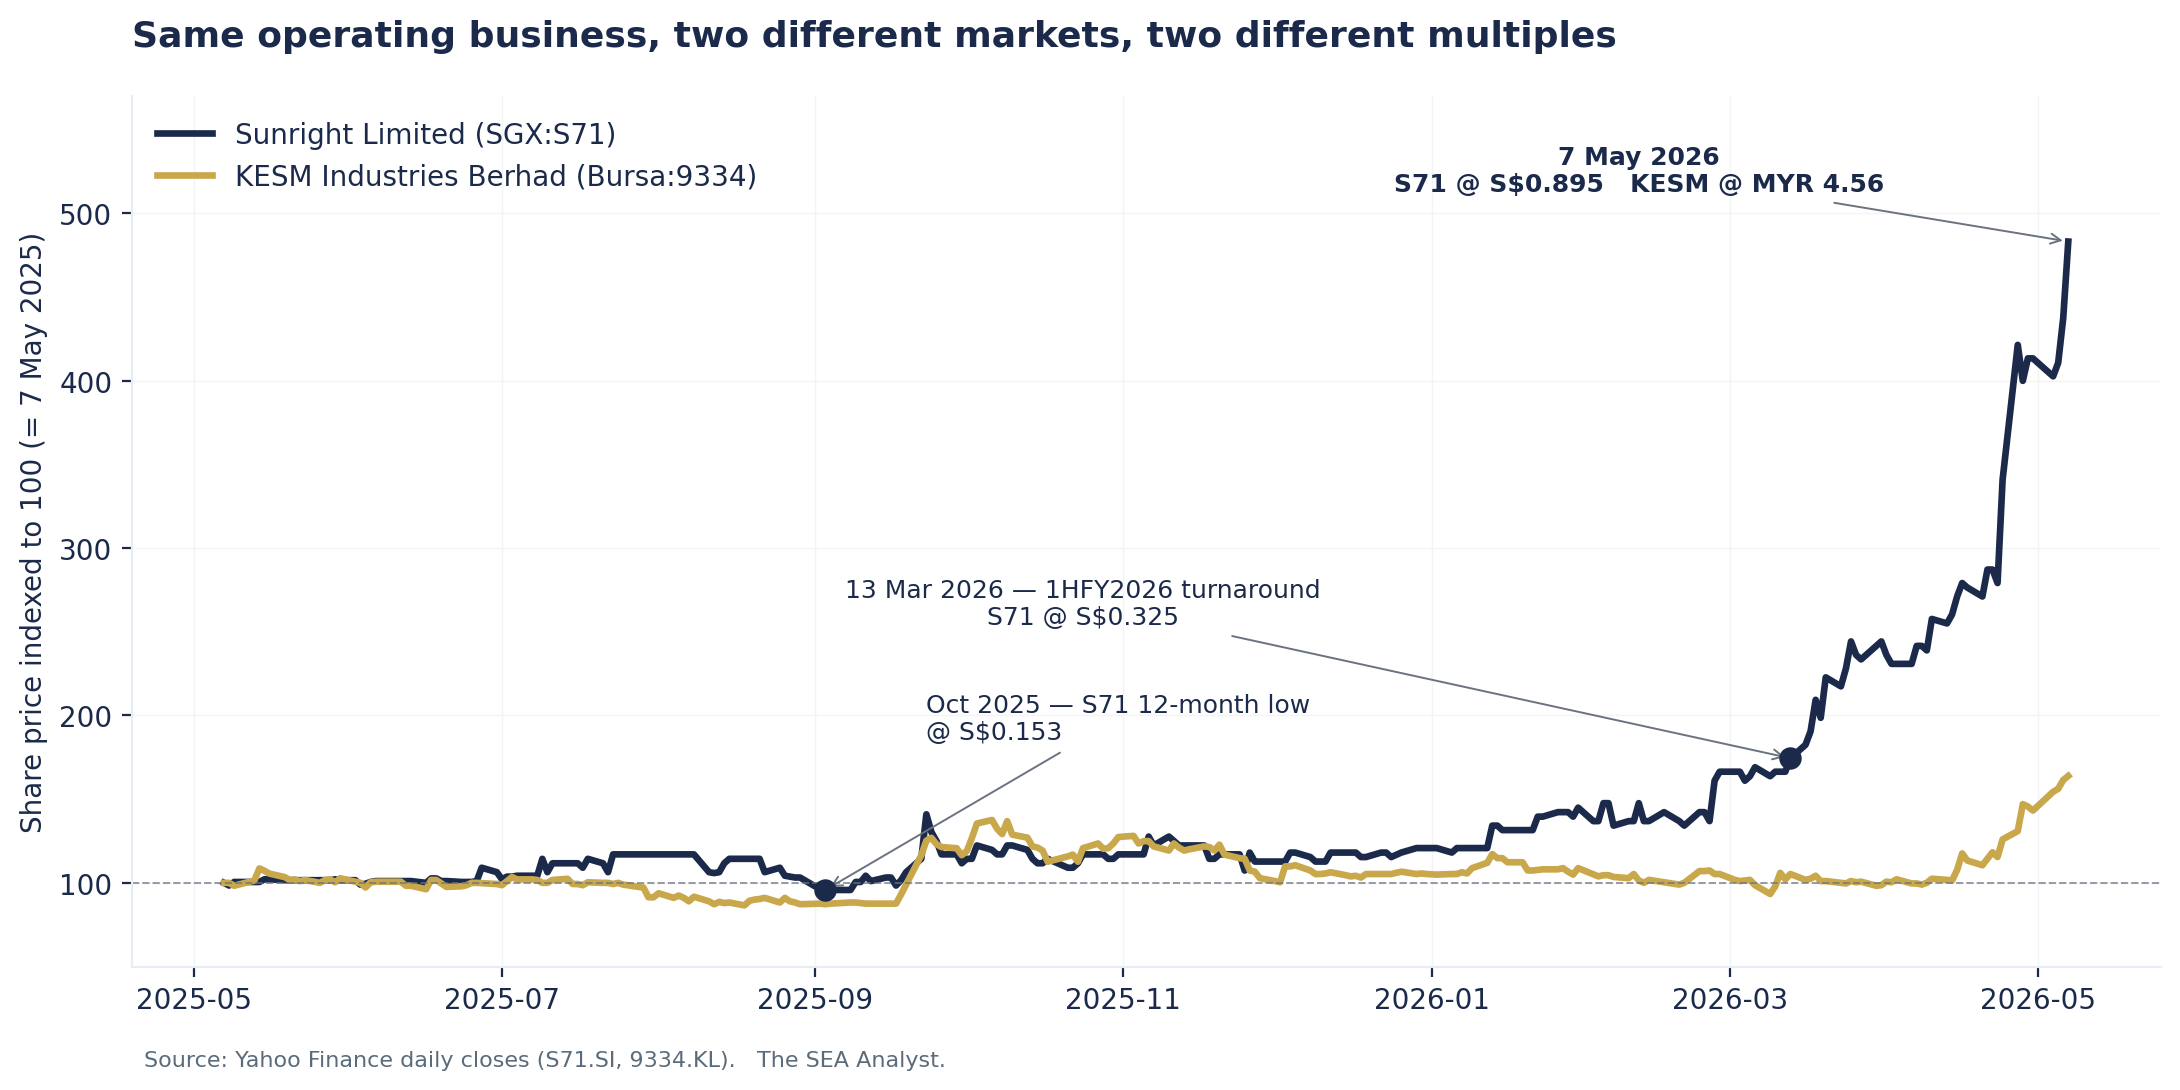
For most of the past decade, Sunright Limited’s share price moved like a SGX small-cap nobody cared about: a few cents either way, dividend zero or near-zero, occasional flickers of activity around the AGM and the half-year results. Then in late 2025 something changed. The share price was 15.3 cents at its 12-month low. By 13 March 2026, the day Sunright reported its 1HFY2026 turnaround, it had reached 32.5 cents. By late April 2026, the Singapore financial press was running columns on the rotational interest into Sunright, AEM Holdings and UMS Integration as the city’s “semiconductor value-chain” stocks found an audience. By 7 May 2026, the price was 89.5 cents and the market capitalisation had crossed S$110m. Return from the 12-month low: approximately +485%.
The rally is propelled by a real operating turnaround — net profit of S$1.4m in the first half of FY2026 against a S$4.6m loss in 1HFY2025 — and by a credible AI-data-centre narrative that Executive Chairman Samuel Lim has been articulating consistently in press releases and AGM presentations since at least 2024. But behind the headline lies an arithmetic question the holding-company structure makes uncomfortable: 87% of Sunright’s FY2025 revenue is generated by a separately-listed Malaysian subsidiary, and that subsidiary trades at 0.58x book value on its own exchange, a fraction of where the parent now trades on the SGX.
This is an article about that gap.
How Sunright was built
Sunright Limited was incorporated in Singapore in 1978 by Samuel Lim Syn Soo, a fifty-year veteran of the local semiconductor industry credited with three joint patents for testing of devices. Lim’s career through the 1970s ran across U.S. multinationals in Asia and the United States, on the engineering, manufacturing and marketing side of test-and-measurement businesses. He launched Sunright on the conviction that the reliability bottleneck in semiconductor manufacturing — the long overnight stress test that filtered field-failure devices out of every batch — was a service business that could be productised.
KESM Industries Berhad, established by Lim’s group in 1978 in Kepong, Selangor, had by 1983 relocated to Petaling Jaya. Lim then established KESP Sdn. Bhd. in the Bayan Lepas Free Industrial Zone in Penang to expand burn-in capacity into Malaysia’s emerging electronics-manufacturing hub. KESM Industries listed on the Main Board of Bursa Malaysia in 1994, structuring the parent–subsidiary relationship that defines Sunright’s accounting and economics today: Sunright owns 48.41% of KESM, but consolidates KESM as a subsidiary because Lim — Sunright’s Executive Chairman and CEO — also holds the same titles at KESM, and Sunright’s directors are duplicated on the KESM board. De facto control flows through governance, not equity.
Sunright entered FY2026 with 122,806,266 shares outstanding, a Singapore Mainboard listing, and almost five decades of operating history almost entirely in burn-in/test services rather than equipment.
What you are actually buying
The principal activities of Sunright Limited as the parent entity are described in the FY2025 annual report as “investment holding and provision of management services.” The operating business — burn-in and testing services to global semiconductor customers — sits inside the consolidated group, and the dominant operating entity within that group is KESM Industries Berhad and its Malaysian subsidiaries.
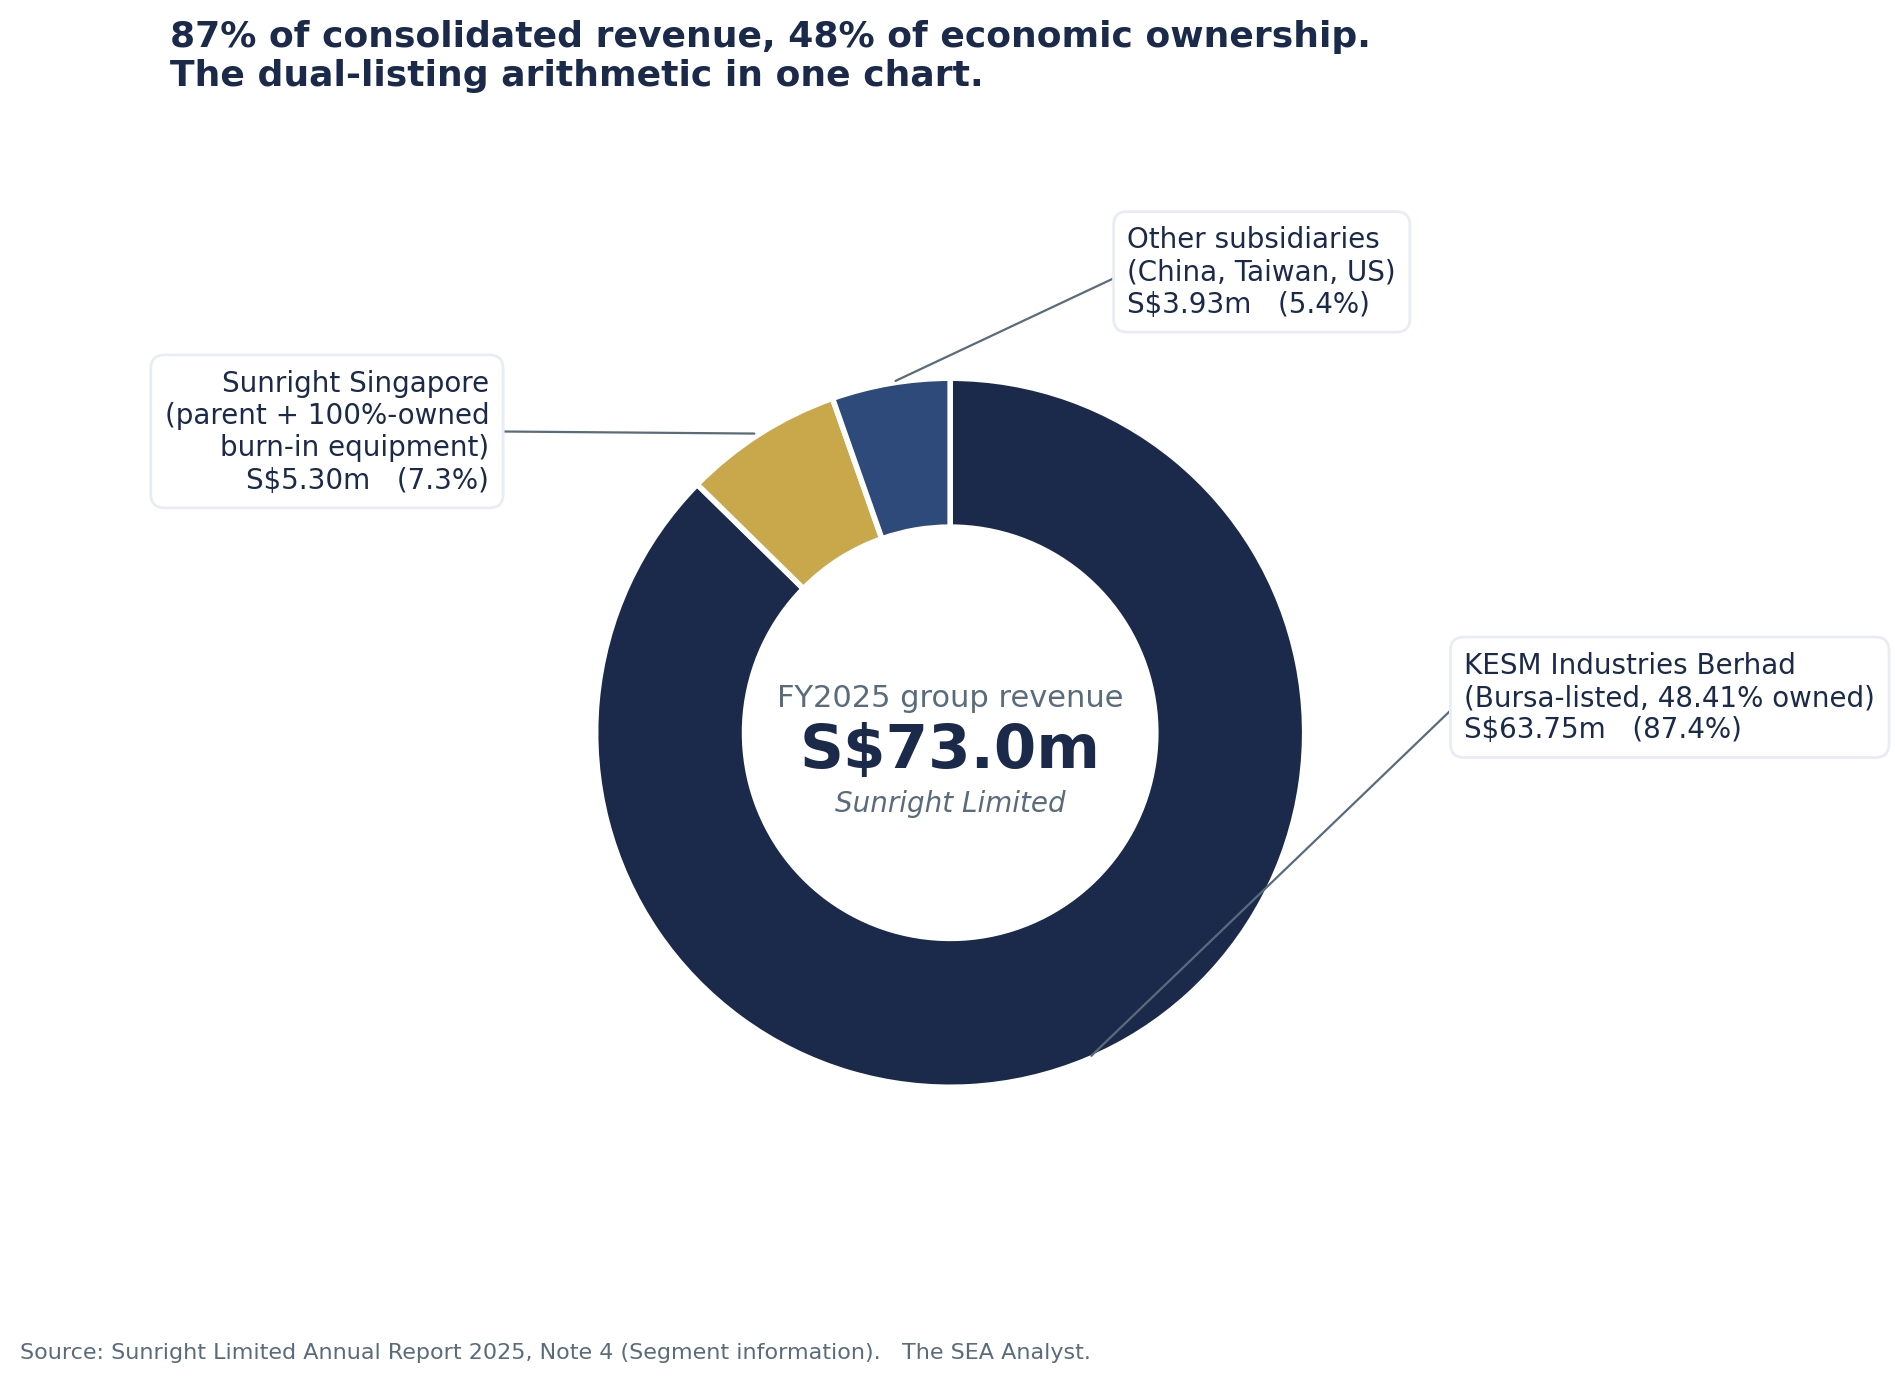
The numbers are decisive. In FY2025 (financial year ended 31 July 2025), Sunright’s group revenue was S$72.98m. KESM’s contribution to that group revenue was S$63.75m, or 87.4%. Sunright Singapore’s direct revenue contribution — equipment manufactured under the Sunright brand and sold to customers globally — was S$5.3m, or 7.3%. The remainder came from smaller subsidiaries in China and elsewhere, several of which (KEST Taiwan, KES Shanghai) were liquidated in FY2024–FY2025 as the China–US trade environment compressed China’s role in the group’s footprint.
Two facts about that 87% are worth dwelling on. First, KESM is consolidated as a subsidiary under SFRS(I), meaning every dollar of KESM revenue, every dollar of KESM operating cost, and every dollar of KESM net asset shows up in Sunright’s consolidated financial statements. Second, only 48.41% of KESM’s economic interest belongs to Sunright shareholders. The remaining 52% is held by Bursa Malaysia investors, including KESM minority shareholders who can buy KESM directly without the holding-company layer. This 52% economic interest is presented in Sunright’s balance sheet as “Non-controlling interests” and at 31 July 2025 stood at S$53.39m, against attributable equity of S$69.24m. Group equity totalled S$122.63m. Sunright shareholders own less than 60% of the consolidated equity they read about in the headline announcements.
The Singapore-incorporated parent (Sunright Limited as a standalone entity) reported total Company-level equity of S$29.2m at 31 January 2026 against total assets of S$33.7m. Those assets are dominated by S$17.6m of cash and short-term deposits, S$9.5m of trade and other receivables, and S$5.6m of investment in subsidiaries (at carrying value), with small balances of investment securities, prepayments and intra-group loans against S$4.5m of liabilities (S$3.3m of loans and S$1.2m of payables and tax). The parent entity is essentially a holding-and-treasury function. The operating business is downstream.
The industry behind the numbers
Burn-in and test services sit between wafer fabrication and final assembly. After a chip is packaged but before it ships, it goes through hours or days of temperature, voltage and signal stress to filter out infant-mortality failures — the small percentage of devices that would fail in a customer’s product within months of deployment. For automotive, industrial, military and AI/data-centre semiconductors where field failure is unacceptable, burn-in is non-negotiable. For consumer parts, it has historically been done in-house by IDMs or skipped on commodity grades.
The addressable market for outsourced burn-in is a sub-segment of the broader OSAT (outsourced semiconductor assembly and test) industry. Multiple research providers size the global OSAT market at USD 39–47bn in 2023–2025, growing to USD 58–73bn by 2030 at single-digit CAGR (Grand View Research, Next Move Strategy, Virtue Market Research). The wafer-level burn-in and reliability test sub-segment specifically (including equipment and services) is forecast to grow at 14.8% CAGR from USD 2.26bn in 2025 to USD 4.51bn by 2030 (Virtue Market Research). The fastest-growing slice of the test stack is the slice nearest to AI processor reliability requirements — exactly the workload Sunright/KESM and Aehr Test Systems both serve.
That is the context for the rally, and for management’s repeated framing in the FY2025 annual report and 1HFY2026 press release of AI/data-centre and automotive semiconductors as the two pillars of the next leg of growth. Worldwide semiconductor revenue was USD 793bn in 2025 (+21% YoY, per the 1HFY2026 outlook commentary), and the company quotes industry forecasts of USD ~1tn by 2030. Sunright and KESM both describe themselves in their corporate materials as the world’s largest independent burn-in and test service provider, a relative position within a niche rather than an absolute scale claim. KESM’s standalone revenue of MYR 210.5m in FY2025 (~USD 47m) is a single-digit-percent share of the global outsourced burn-in services market.
The Malaysian semiconductor cluster mapping (Inari Amertron, Globetronics, Unisem, Pentamaster, MPI, ViTrox, Carsem and the customer-side IDM footprint) and the Aehr Test Systems competitive read-across in detail are in the institutional-length version of this piece.
Moat, with caveats
Two moat characteristics defend Sunright/KESM. First, the engineering integration with customer chips: every burn-in fixture and test program is co-developed with the customer over months of qualification work, and the switching cost (repeating that qualification cycle with another vendor) is real. Second, the geographic placement of capacity: KESM’s Petaling Jaya and Penang plants sit close to the Malaysian and regional packaging operations of major IDMs and OSATs, allowing tight integration with assembly logistics. These are durable advantages within the existing customer base.
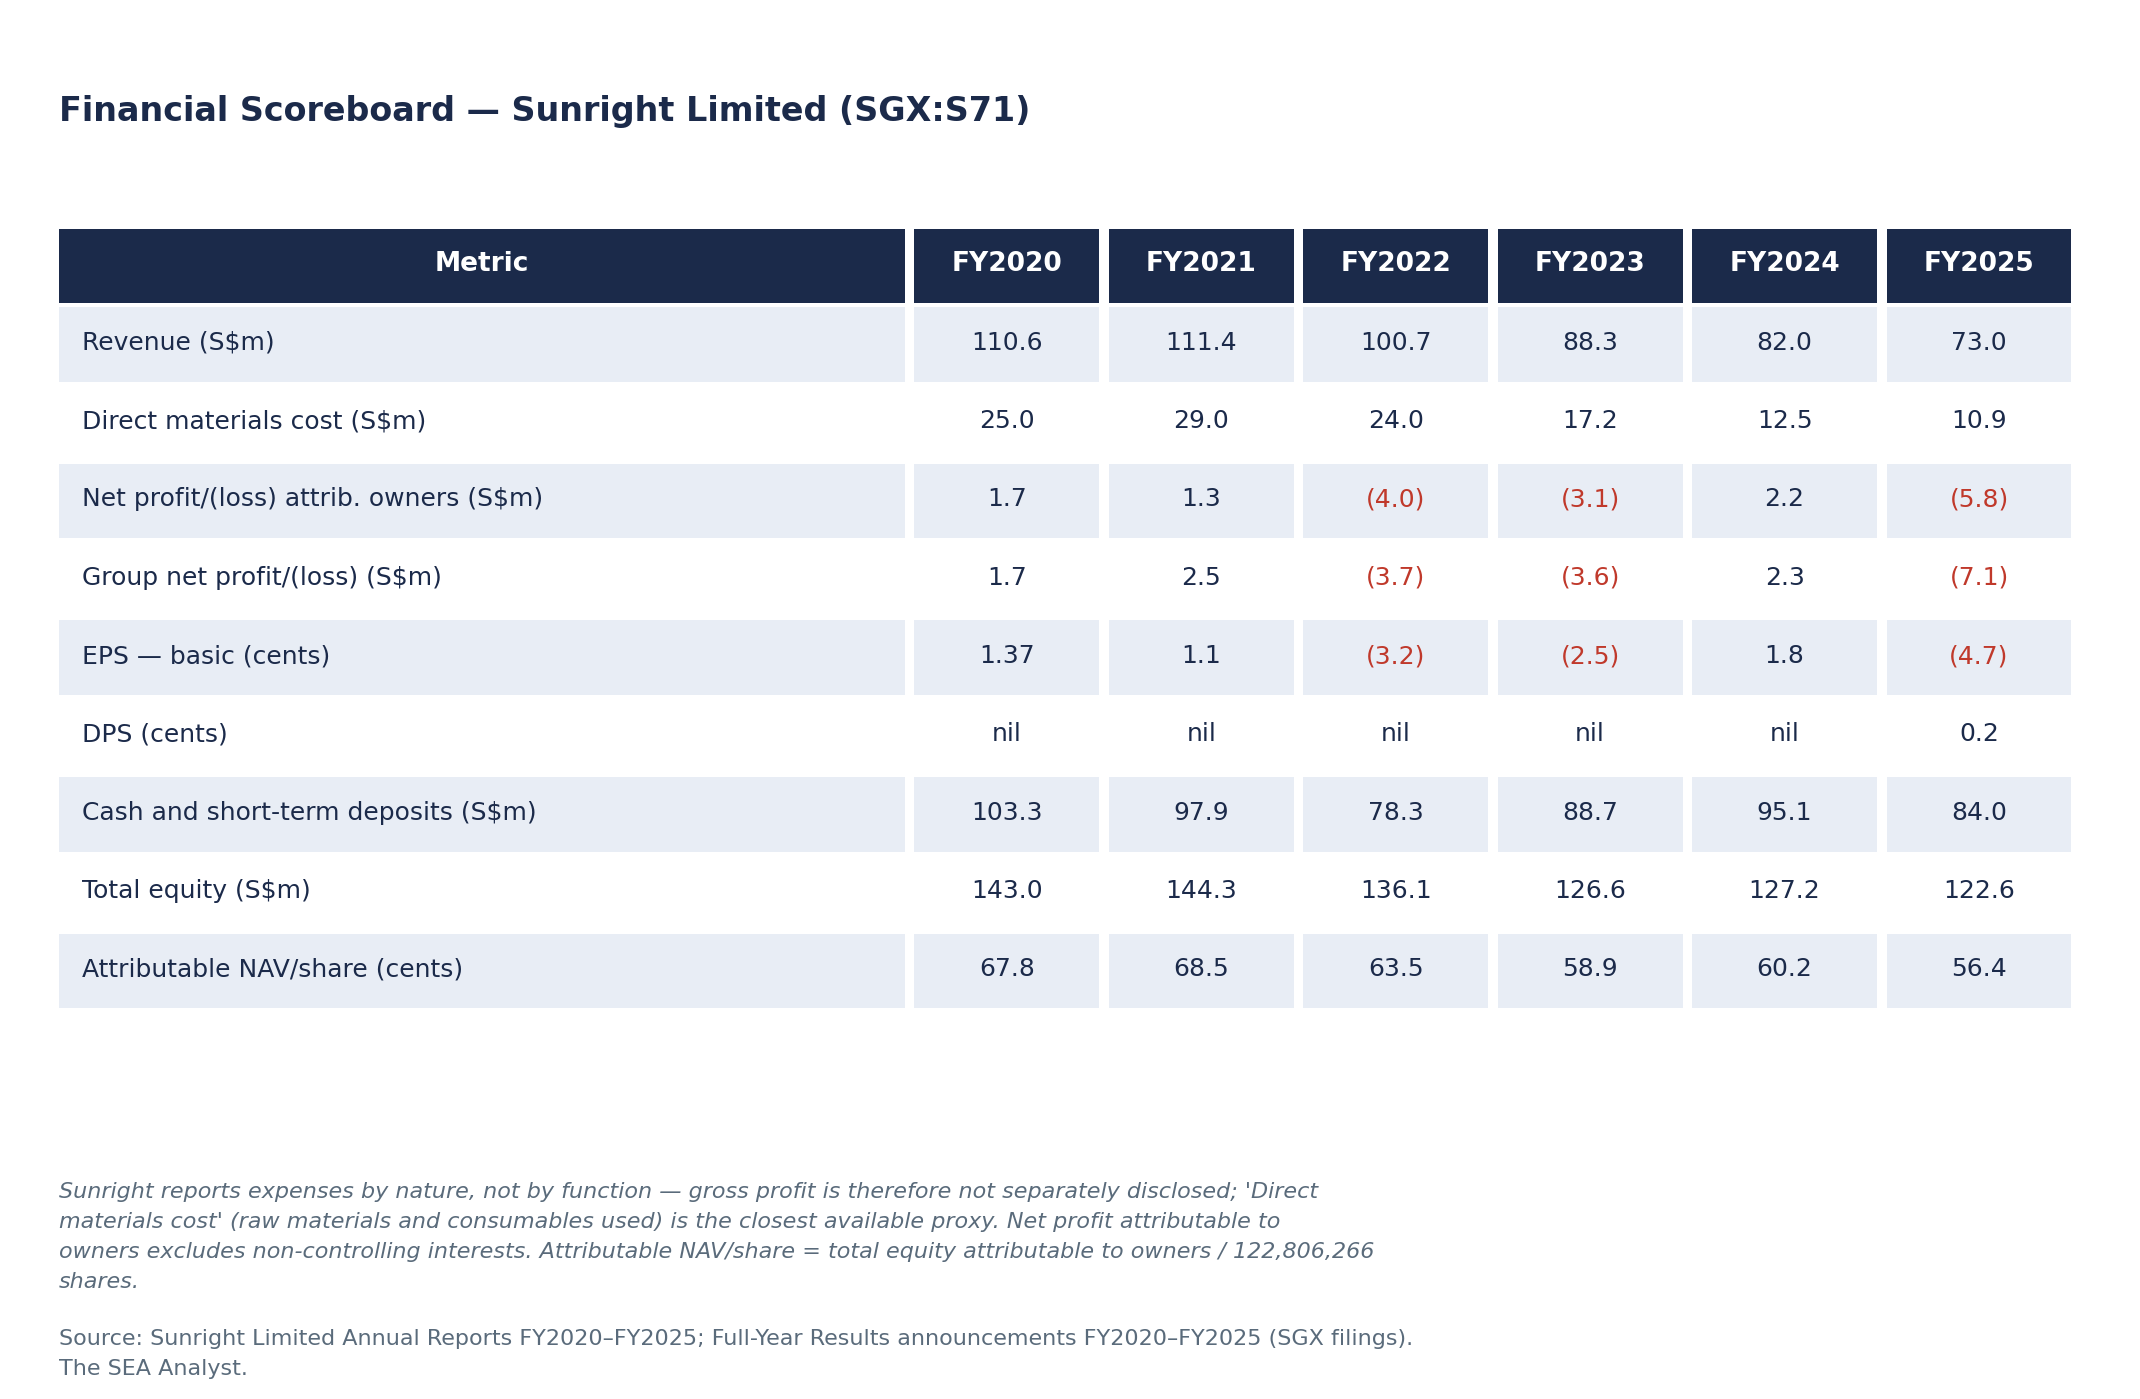
The financial track record is equivocal. Across FY2020–FY2025, group revenue ranged from S$73m to S$111m and the income statement oscillated between profit and loss without a clear secular trend. ROE was negative in three of six years. KESM standalone (RM210.5m revenue, RM8.2m loss in FY2025) shows the same volatility on its own scale. The S$67.6m of net cash at 1HFY2026 is a real strength, but it sits alongside the S$11.1m one-half-year capex pulse that signals the company is now reinvesting in capacity, which can either pay off (if AI utilisation arrives) or become depreciation drag (if it doesn’t). A moat that does not deliver consistent earnings needs explanation, and Sunright offers a cyclical one (demand swings, customer concentration, capacity utilisation). That explanation is honest. It is not a moat in the sustainable-economic-rent sense.
Financial Scoreboard
What the capital actually earns
Across FY2020–FY2025, Sunright’s six-year cumulative net loss attributable to owners was S$7.7m, against an opening attributable equity base of S$82.5m at FY2019 year-end. Average attributable equity over the period was approximately S$77m, implying a cumulative ROE of approximately negative 10%, or roughly negative 1.7% per annum on average. This is below the cost of equity by any reasonable measure.
Returns on invested capital tell a similar story. Property, plant and equipment averaged S$50m over the period and operating profit averaged near zero, implying ROIC indistinguishable from zero on the operating asset base. Interest income on the S$80–100m cash pile contributed S$1.3–2.6m annually, meaningful relative to operating profit and material to the resilience of the headline P&L during cyclical downturns. The capital that earned its keep was the Treasury portfolio, not the operating asset.
The corollary: if 1HFY2026’s S$11.1m capex inflection signals a sustained reinvestment cycle, that capital must earn a meaningful return on a S$50m PP&E base. Management’s working assumption is implicit in the H1 print: they are betting that AI-driven burn-in volumes will absorb the new capacity at higher utilisation than the FY2020–FY2025 average. The bet is not unreasonable. It is also not yet evidenced.
A second view comes from the labour cost line. Employee benefits expense as a percentage of revenue rose from 38.2% in FY2020 to 45.9% in FY2025 as revenue (down 34%) fell faster than headcount cost (down 21%). Burn-in testing is a services-and-people business: KESM has to keep paying its engineers and operators whether the test cells are running near full or only half full. When semiconductor demand is weak the fixed labour bill crushes margins (which is why FY2025 turned into a loss year); when factories ramp back up, revenue grows while headcount cost stays roughly flat, and the spare capacity drops straight to profit. That dynamic is the engine behind the 1HFY2026 turnaround. In 1HFY2026 the labour ratio compressed to 41.3% (employee expense −6% YoY against revenue +15%), the first material sign of the leverage running in the right direction. Whether the FY2025 45.9% reading was cyclical drag (under-utilisation) that compresses with revenue recovery, or structural drag (Malaysian wage inflation plus a skill-mix shift toward AI burn-in engineers) that persists, is the underwriting question Q3 and Q4 FY2026 will settle.
Dividends, and the asymmetry that hides inside them
Sunright paid no dividend across FY2020–FY2024. In FY2025 it declared a 0.2 cent final dividend (S$246k total payout), described in the FY2025 chairman’s statement as recognition of shareholder support during a loss year. At the 7 May 2026 share price, that implies a yield of 0.22%. Symbolic, not income.
Beneath the headline a more interesting cash flow runs. KESM Industries — the 48.41%-owned subsidiary — has paid a dividend in every one of the past five years (6 to 9 sen per share, source: KESM Industries Berhad Annual Report 2025 five-year summary). In FY2025, despite reporting a RM8.2m net loss, KESM declared 6 sen per share. Sunright’s FY2025 consolidated cash flow shows S$504k of “Dividends paid to non-controlling interests”: cash leaving the consolidated group to KESM’s Bursa minority shareholders during the financial year. The corollary cash inflow to Sunright (the parent’s share of KESM’s dividend, ~48.41%) is netted against intra-group transactions and is not separately disclosed. The structural feature: KESM’s dividend policy is set by the KESM board (chaired by Samuel Lim, who is also chair of Sunright), and KESM’s policy of paying dividends through cyclical loss years means cash is distributed to the 51.59% Bursa minority even when the consolidated group is in loss-making mode.
This is the dual-listing tax. It is not abusive. It is not unusual. But it is a recurring, structural cost of the holding-company arrangement that the headline group financials do not isolate. In plain terms: every time KESM declares a dividend, only 48.41% flows up to Sunright shareholders; the other 51.59% leaves the consolidated group entirely, paid to Bursa minorities. Sunright shareholders also receive a 0.22% yield from their own company, but that low number is a separate problem — Sunright sits on S$84m of cash and could pay much more. The leak is structural; the meagre yield is a board choice.
Growth drivers, and what would have to be true
Three growth drivers are explicitly invoked by management across the FY2025 annual report, the FY2025 AGM presentation (delivered 21 November 2025), and the 1HFY2026 commentary: AI/data centre, automotive semiconductors, and an “expanded portfolio” of wafer, package and module-level burn-in and reliability test solutions.
The AI/data-centre driver is credible at the demand-signal level. Aehr Test Systems’ record USD 41m order from a hyperscale AI customer in April 2026 confirms that AI processor manufacturers are spending materially on burn-in. That order was for package-level burn-in (PLBI) — the same architecture KESM operates in (Aehr competes in both wafer-level via FOX-XP and package-level via Sonoma; recent hyperscale wins are on the package side). Translation into Sunright/KESM revenue therefore depends on whether hyperscalers consolidate PLBI spend with turnkey equipment vendors (Aehr) or with third-party service capacity (KESM). The outcome is binary at the customer level and probabilistic at the portfolio level.
The automotive semiconductor driver is more familiar territory. KESM has supported automotive customers for decades. The forecast cited in KESM AR2025 (automotive semiconductor revenue USD 77bn in 2025 to USD 88bn by 2027) is a low-double-digit growth runway. If KESM holds its share, automotive can plausibly contribute single-digit-percent annual revenue growth.
The third driver — wafer, package and module level expansion — was disclosed in the KESM FY2025 chairman’s statement as a new offering for FY2026. The S$11.1m of 1HFY2026 capex (against S$2.7m a year ago) is the financial expression. By the time the FY2026 annual report is published in September 2026, the early customer adoption data will be in.
Risks, with numbers attached
Customer concentration. In FY2025, three customers accounted for S$48m of the S$73m group revenue (66%). The identity of these customers is not disclosed. Loss of any one of them would produce a step-change to group revenue of approximately S$10–20m, equivalent to 14–27% of FY2025 revenue.
Geographic concentration. FY2025 revenue: Malaysia 60% (billing geography), China 18%, US 8%, Singapore 7%, others 8%. Malaysian electronics-export policy and US tariff actions affect the KESM cost base directly.
Cycle risk. Revenue declined for three consecutive years from FY2022 (S$100.7m) to FY2025 (S$73.0m), a 28% peak-to-trough. The cycle bottom is now plausibly behind, but the FY2026 recovery is one half-year of data.
Texas litigation. Weatherford v. KES Systems, Inc. (filed May 2019, Midland County, Texas) remains active as of the FY2025 annual report. Sunright has made no provision; financial exposure is unquantified. EDGAR full-text search of Weatherford International plc 10-K filings 2019–2026 returned zero hits for “KES Systems”; the case is not separately disclosed in Weatherford’s SEC filings, which suggests the company considers it immaterial to the plaintiff’s USD 5bn-revenue scale. The fact that Weatherford does not surface KES Systems in its disclosures does not bound Sunright’s exposure; it merely indicates the absence of a public quantum signal.
Holding-company governance. Samuel Lim holds 54.94% of Sunright and is Executive Chairman and CEO of both Sunright and KESM; Kenneth Tan Teoh Khoon is Executive Director of both. Capital allocation sits with overlapping boards under a single controlling shareholder.
Currency. KESM’s MYR revenue translates into Sunright’s SGD reporting; FY2025 reported S$3.5m of FX translation gain in OCI. Generally a wash, but volatile period to period.
Deep dive: the holding-company arithmetic
The central thing to understand about Sunright is not in the consolidated statement of profit or loss. It is in the relationship between two stock prices.
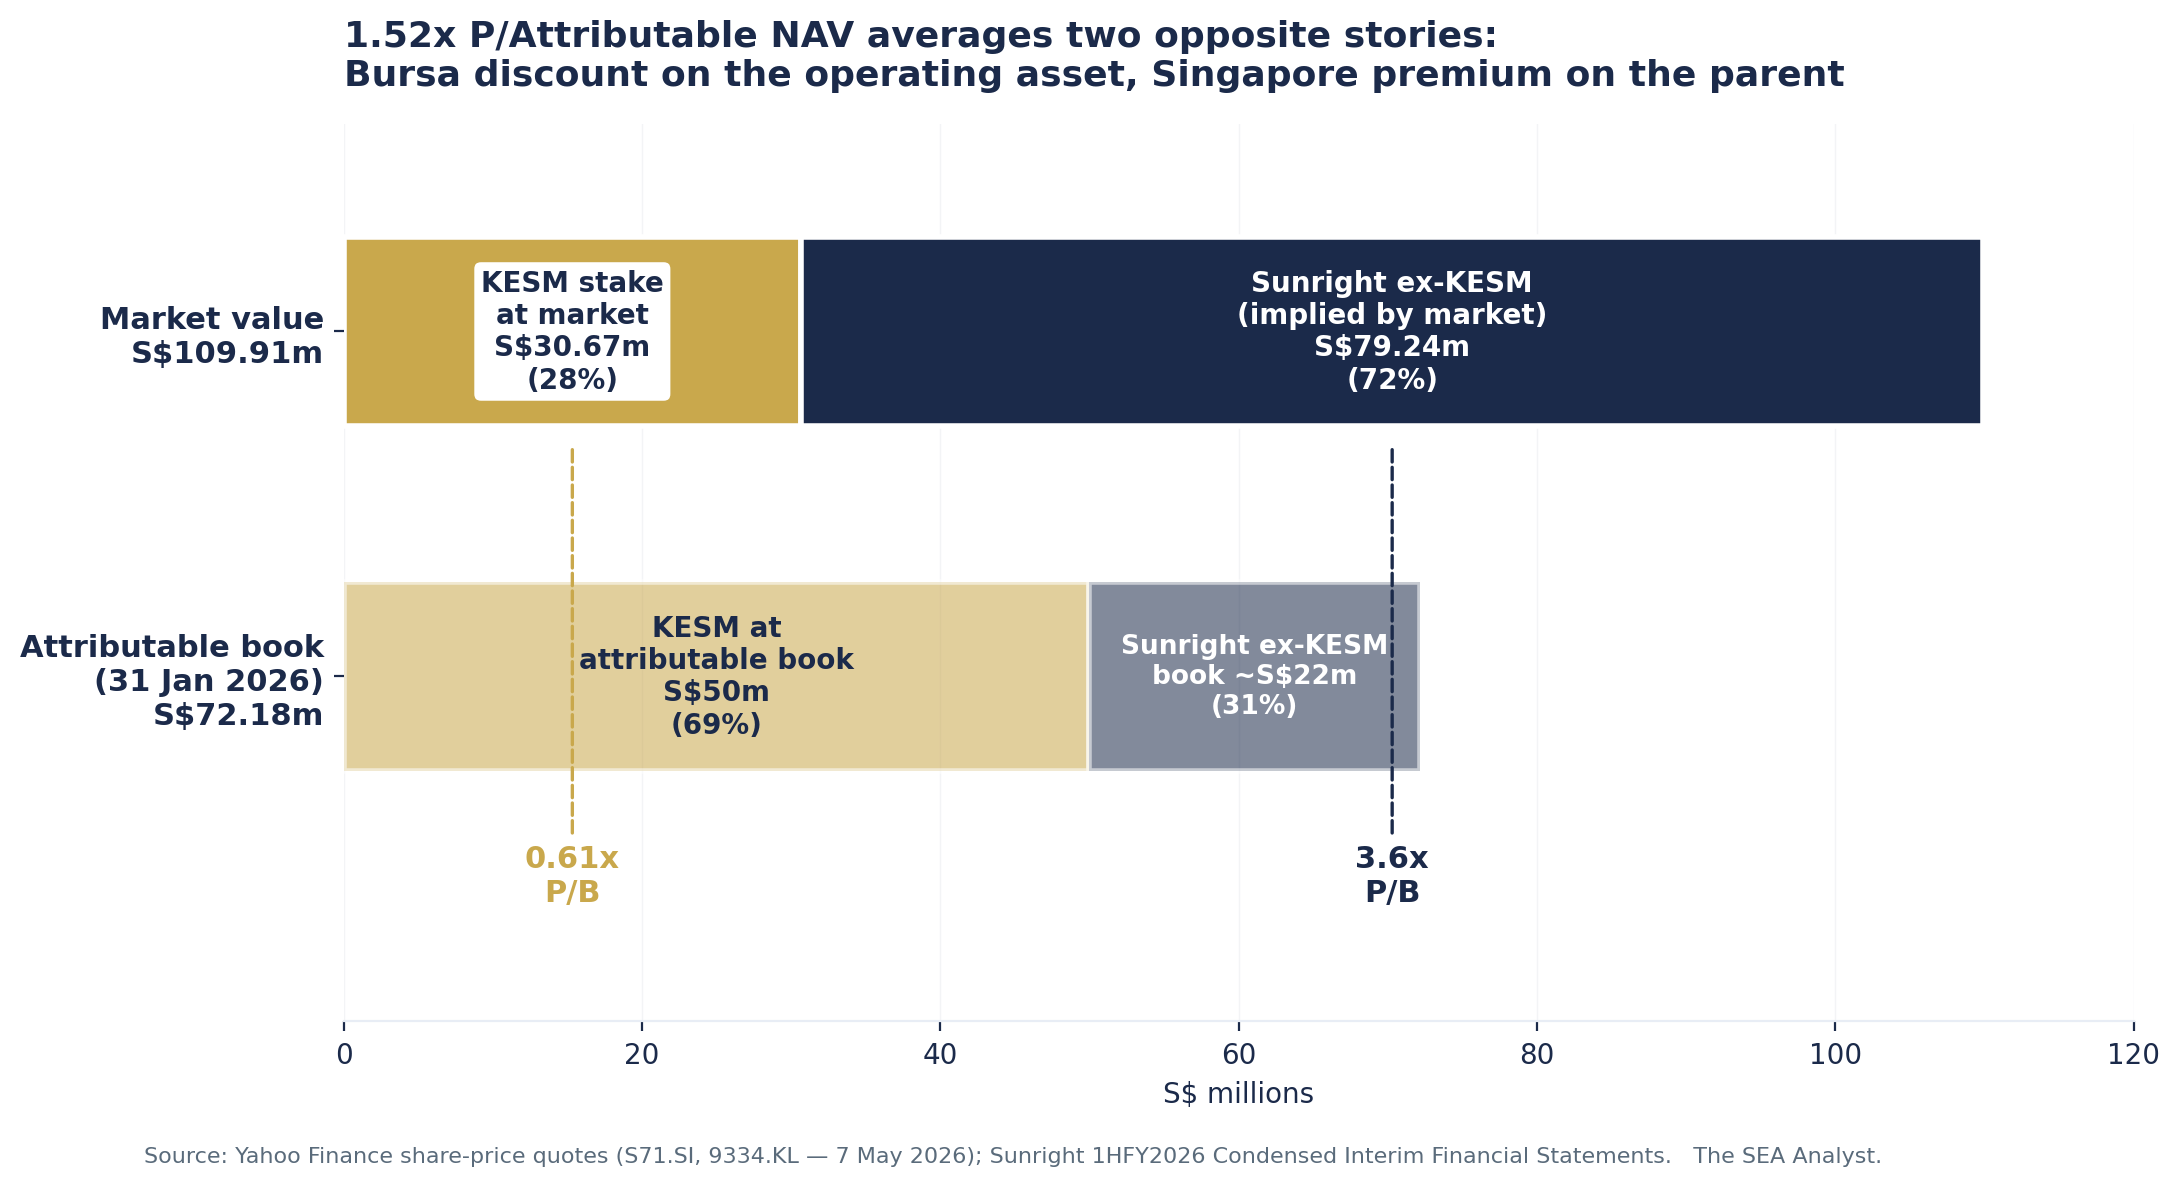
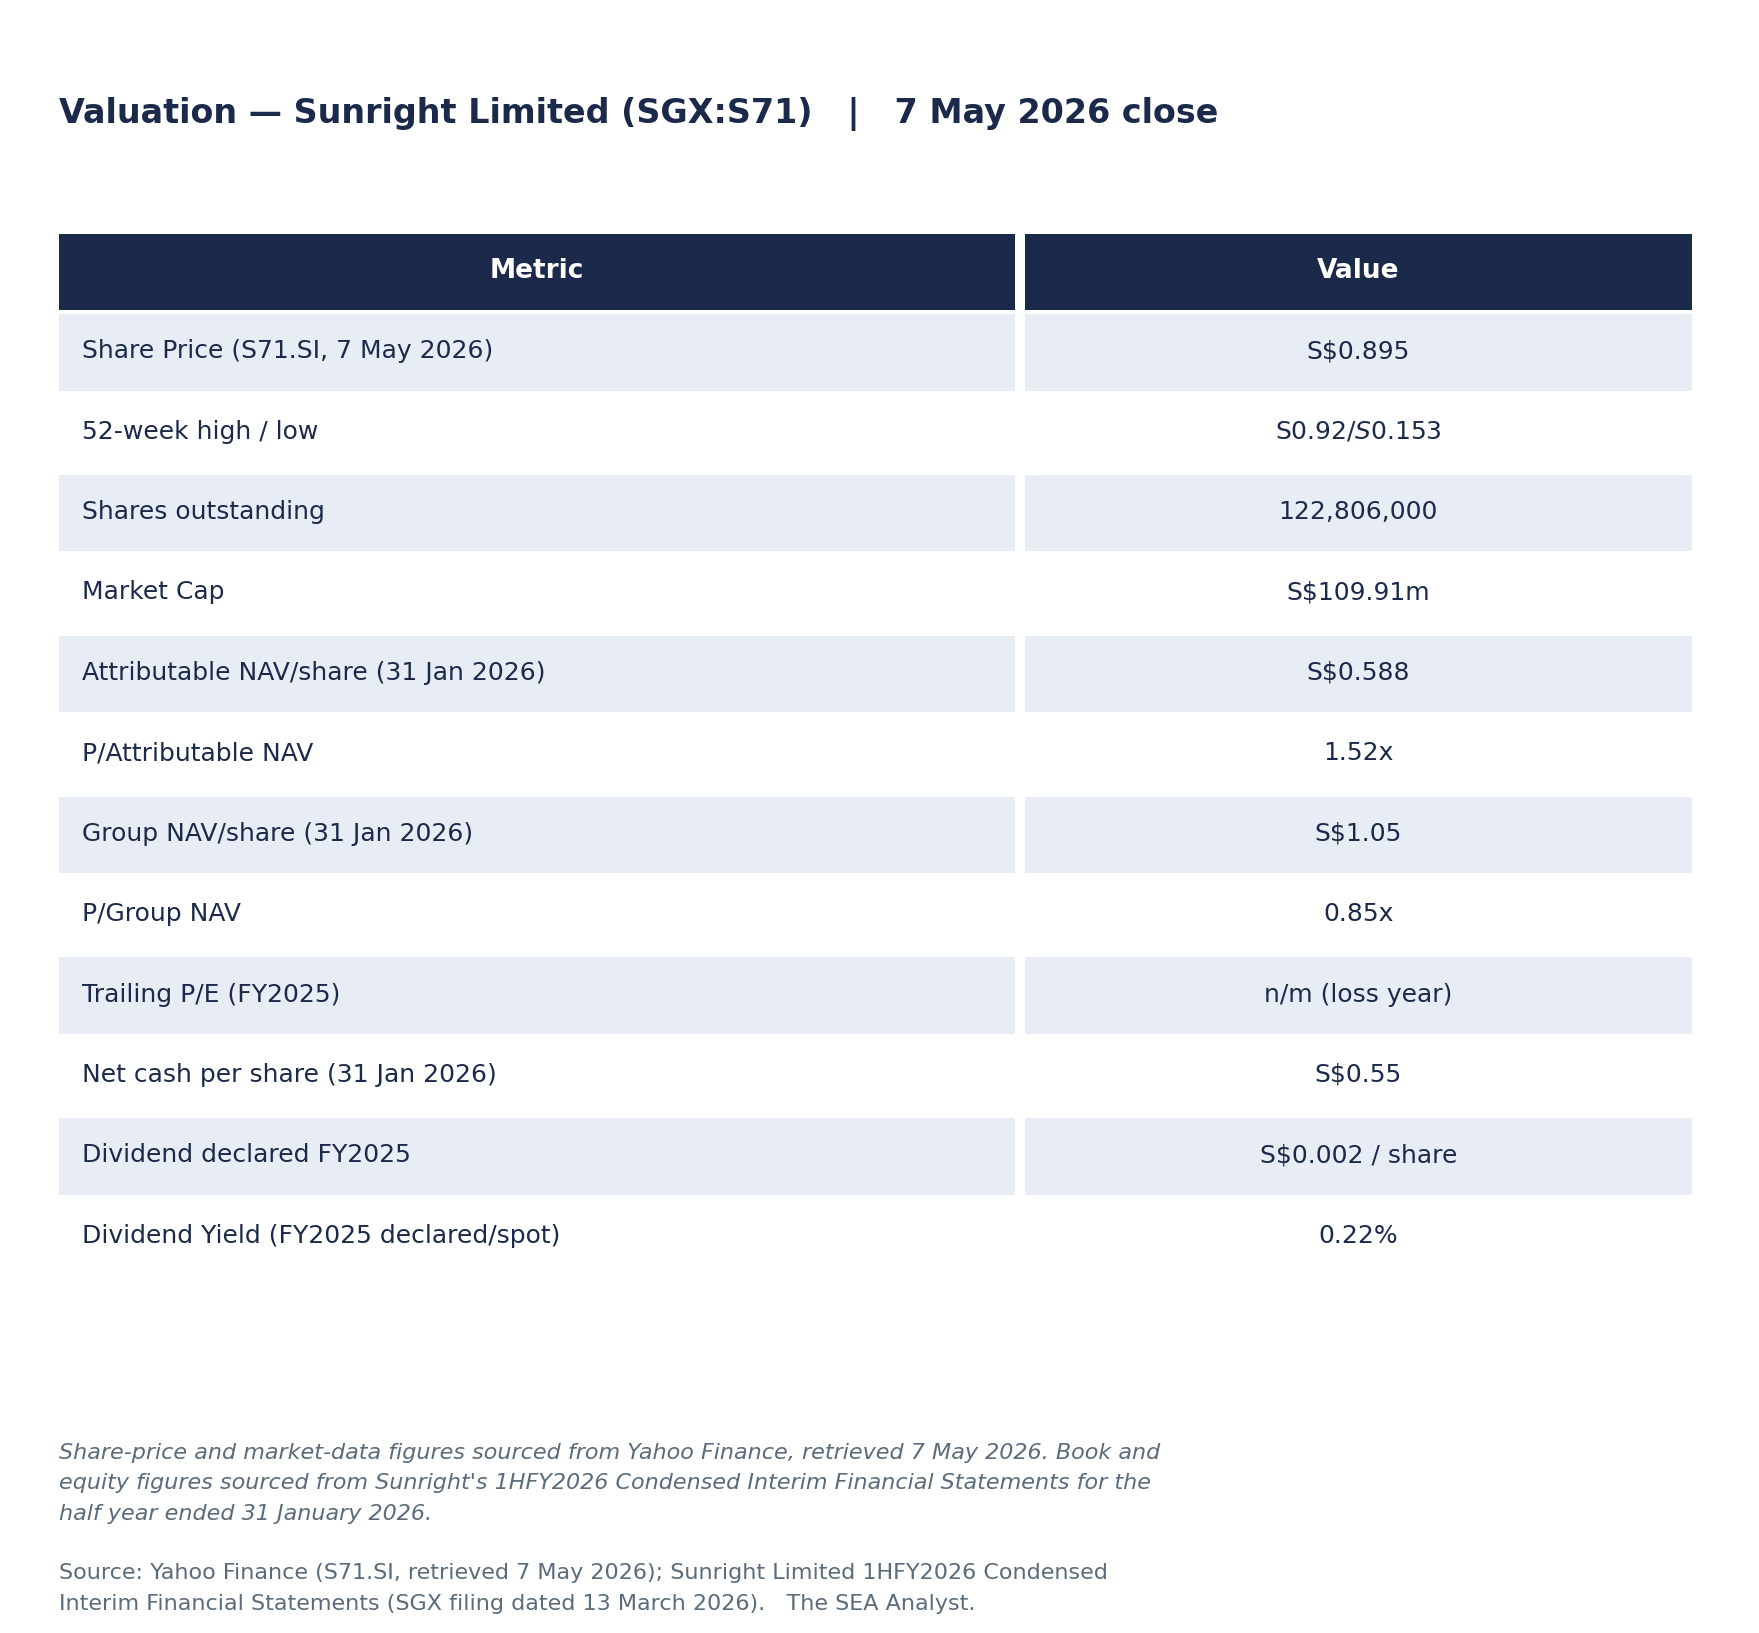
At the close of 7 May 2026, Sunright was at S$0.895 per share, with 122.806m shares outstanding, for a market capitalisation of S$109.91m. KESM Industries was at MYR 4.56 per share, with 43.0145m shares outstanding, for a market capitalisation of MYR 196.15m. At the spot exchange rate of MYR/SGD 0.323 (Yahoo Finance, 7 May 2026), KESM’s market capitalisation translates to S$63.36m. Sunright owns 48.41% of KESM, so the market value of Sunright’s KESM stake is S$30.67m.
Sunright’s market capitalisation decomposes look-through. Group equity attributable to owners at 31 January 2026 was S$72.18m. Of that book, approximately S$50m is Sunright’s 48.41% share of KESM’s standalone book equity (KESM standalone equity at 31 July 2025: MYR 339.17m). The remaining ~S$22m sits at the Singapore parent and smaller non-KESM subsidiaries.
When the market values Sunright at S$109.91m and 48.41% of KESM at S$30.67m, it is implicitly valuing “Sunright ex-KESM” at S$79.24m against an accounting book of approximately S$22m. The result is two very different multiples on the same balance sheet:
KESM stake: market value S$30.67m, consolidated book ~S$50m → 0.61x P/B
Sunright ex-KESM (Singapore parent + non-KESM subs + treasury): implied market value S$79.24m, attributable book ~S$22m → 3.6x P/B
In plain terms: the market pays about 61 cents on the dollar for KESM’s share of the operating business (factories, equipment, working capital, cash), but roughly $3.60 per dollar for the Singapore holding shell that owns it. Same physical assets, valued differently depending on which exchange you look through. The two multiples sit on either side of the headline 1.52x P/Attributable NAV, and they do not move together.
If KESM rerated to 1.0x book over 18 months (MYR 7.89 per share, a +73% move from MYR 4.56), Sunright’s stake would rise to S$53.0m, an uplift of S$22.4m or 18.2 cents per Sunright share. That is the size of the convergence trade available to a Sunright shareholder if the Bursa view of KESM closes the gap to consolidated book.
The convergence trade requires more than waiting. KESM has traded below book for most of the past five years. Closing the gap requires sustained earnings improvement at KESM specifically, not at Sunright in aggregate. KESM’s standalone 1HFY2026 result (Bursa, 10 March 2026) was a modest revenue uplift to approximately RM108m, +4% YoY. If Q3 and Q4 FY2026 continue that direction, the gap narrows. If they don’t, Sunright’s 3.6x ex-KESM multiple gets very hard to justify on a Singapore parent that generated S$5.3m of FY2025 revenue and is loss-making at the entity level.
Management
Samuel Lim Syn Soo, Executive Chairman and CEO since founding in 1978, is 71 years old. The succession question is not formally addressed in the FY2025 annual report or in the 21 November 2025 AGM presentation. Kenneth Tan Teoh Khoon, age 68, has been Executive Director since 1992 and is the long-standing financial steward of the group; he sits on both the Sunright and KESM boards. Ms Lim Mee Ing, age 74, is a Non-Independent Non-Executive Director on the KESM board (since 1990) — surname coincidence aside, her presence is itself a governance flag for minority investors who care about director-related-party concentration. Daniel Soh is Sunright’s Lead Independent Director (also age 71). The board added Dr Babak Alizadeh Taheri, an independent director with technology and governance background, on 22 November 2024, consistent with SGX corporate governance code refresh requirements. No internal successor has been named publicly for either Lim’s role.
The capital allocation track record is mixed. Cash has been preserved (S$84m at FY2025 versus S$93m at FY2019), but capex was held below depreciation for most of the post-FY2020 period, implying capacity contraction in real terms. Dividend distribution has been near-zero. The S$11.1m H1 capex pulse is the most material pivot in five years. Management has not provided forward guidance.
The most material governance disclosure is the Lim dual role. Samuel Lim is Executive Chairman and CEO of Sunright (Singapore) and Executive Chairman and CEO of KESM Industries (Malaysia). The two roles cannot, in principle, be conflict-free at all times — KESM’s dividend policy, KESM’s capex priorities, and Sunright’s capital allocation between Singapore and Malaysia all involve choices between Sunright minority interests and KESM minority interests. Lim’s 54.94% stake in Sunright aligns him with Sunright shareholders; the KESM stake (held through Sunright) aligns him with KESM majority. The two minorities — Sunright SGX retail and KESM Bursa retail — receive whatever is left after both controlling stakes have voted. There is no public evidence of mismanagement, but the structural arrangement creates a permanent asymmetry that minority investors should price.
Valuation
Bull vs Bear
Bull case. The 1HFY2026 print is the first half-year in three years where revenue and operating direction agree. Sunright/KESM describe themselves as the largest independent package-level burn-in service operators, and the AI hyperscaler capex cycle that drove Aehr’s record USD 41m PLBI booking in April 2026 is direct demand validation for the same architecture KESM operates in. The S$11.1m of 1HFY2026 capex is leveraged exposure to AI-driven utilisation gains. The S$67.6m of net cash supports the downside. If KESM reports a strong 2HFY2026 and Bursa reflects the recovery, Sunright shareholders capture both the consolidated earnings recovery and a partial closure of the P/NAV gap. With FY2027 attributable equity of ~S$80m (flat NCI, S$10m cumulative profit accrual) and Sunright at 1.5x attributable NAV, the share price is S$0.98 — modest single-digit upside. At 2.0x attributable NAV, S$1.30, or ~46% upside. Either requires KESM execution.
Bear case. The S$0.895 share price already reflects two consecutive halves of operating recovery and an AI narrative. The 12-month low was S$0.153; almost the entire upside has been delivered in the seven months since October 2025. KESM’s Bursa share price has not moved with comparable amplitude. If hyperscaler PLBI volumes flow to integrated equipment vendors (Aehr) rather than third-party services (KESM), the S$11.1m capex underutilises and depreciation drag pulls ROIC back toward zero. A second half-year of sub-MYR 200m KESM revenue combined with any Texas litigation development would compress the multiple toward 1.0x attributable NAV (S$0.59), a 34% drawdown. The bear case is not catastrophic — net cash supports a floor — but the asymmetry of upside-already-banked versus downside-still-possible deserves underwriting at current prices.
What would break the thesis
The bull case fails on any of the following:
KESM execution: two consecutive flat or negative-growth quarters in 2HFY2026 (Q3 announcement ~10 June 2026, Q4 ~25 September 2026).
Competitive displacement: Aehr Test Systems wins additional package-level burn-in orders from hyperscale customers that are also customers of KESM.
Capital allocation signal: KESM declares a total FY2026 dividend substantially above the 6 sen FY2025 level, signalling capital being returned rather than reinvested and contradicting the H1 capex narrative.
Customer concentration: any one of the three customers contributing 66% of FY2025 revenue migrates volume to a competitor.
Labour leverage: FY2026 full-year employee expense ratio above 44% (vs 41.3% in 1HFY2026, 45.9% in FY2025). A higher reading would signal the labour cost is structural rather than cyclical and would invalidate the operating-leverage component of the bull case.
The bear case fails (i.e. the bull case holds) if the FY2026 full-year results published in September 2026 show group revenue above S$90m and net profit attributable to owners above S$5m. That print would re-anchor the multi-year baseline.
Data points to monitor:
KESM Bursa filings — Q3 FY2026 due ~10 June 2026, Q4 FY2026 due ~25 September 2026.
Sunright FY2026 results announcement — ~late September 2026.
Aehr Test Systems FY2027 quarterly bookings disclosures — NASDAQ filings.
Customer concentration disclosure in the next Sunright annual report.
The Bottom Line
Sunright is a real operating business going through a real recovery, controlled by a real founder and supported by a real net cash position. None of those things are in question.
What is in question is whether the price the SGX is currently asking for that combination — 1.5x attributable book, 0.85x group book, on a stock that has rallied roughly 5x off its 12-month low — has overshot the operating evidence. The answer requires a view on KESM, not on Sunright. KESM’s own market — Bursa Malaysia — currently rates the operating business at 0.58x book, and that view has not materially changed during Sunright’s rally. The Sunright premium is therefore borrowed against an expected closure of the Singapore-Malaysia valuation gap. That closure is plausible. It is not yet evidenced.
A buyer at 89.5 cents is buying optionality on convergence, on AI-driven utilisation, and on a capex pulse delivering returns. A seller is taking the gain on the rally and acknowledging that the convergence trade has timing risk. Neither side is wrong. The article offers no recommendation, only the observation that the asymmetry between the two listings is the most important fact about the share price today, and that fact deserves to be owned as a position whether one is long, short, or absent.
The institutional-length version of this analysis — the historical and structural context, the industry context, the math behind every number, and the data points to monitor going forward — is available to Paid members. Read it here.
Data Integrity Notes
This article uses only company-filed data from SGX and Bursa Malaysia announcement systems and the FY2020–FY2025 annual reports of Sunright Limited and KESM Industries Berhad. Share price and market-capitalisation figures are from Yahoo Finance, retrieved 7 May 2026.
Known limitations: (1) Weatherford v. KES Systems, Inc. (Texas, filed May 2019) remains active. No provision; financial exposure is unquantified. EDGAR full-text search of Weatherford International plc 10-K filings 2019–2026 returned zero hits for “KES Systems”; no public quantum is assignable. (2) Sunright reports expenses by nature rather than function — gross profit is not separately disclosed and “Direct materials cost” is the closest proxy in the Financial Scoreboard. (3) Detailed KESM segment data was sourced from KESM’s own Bursa filings rather than Sunright’s summarised disclosures. (4) The FY2025 Sunright AR discloses three customers at 66% of revenue but does not name them; customer-level analysis is directional. (5) KESM's 1HFY2026 quarterly result (Bursa filing dated 10 March 2026) was available to us at draft date; the +4% YoY revenue trajectory and the loss-to-profit PBT swing were cited based on two third-party summaries. The primary Bursa filing was obtained post-publication (2026-05-11) and verified: all third-party-corroborated figures match the source filing exactly (revenue RM107.95m, PBT RM6.66m vs RM8.08m loss, cash RM195m, 6 sen interim dividend). No corrections required. (6) MYR/SGD spot rate of 0.323 is used throughout.
References
[1] Sunright Limited, Annual Report 2025 (SGX filing dated 26 September 2025).
[2] Sunright Limited, Annual Report 2024 (SGX filing dated 27 September 2024).
[3] Sunright Limited, Annual Report 2023, Annual Report 2022, Annual Report 2021, Annual Report 2020, Annual Report 2019 (SGX filings).
[4] Sunright Limited, Condensed Interim Financial Statements for the First Half Year ended 31 January 2026 (SGX filing dated 13 March 2026).
[5] Sunright Limited, Full-Year Results announcements FY2020–FY2025 (SGX filings).
[6] Sunright Limited, Press Release — 1HFY2026 (SGX filing dated 13 March 2026).
[7] KESM Industries Berhad, Annual Report 2025 (Bursa Malaysia filing dated October 2025).
[8] KESM Industries Berhad, Annual Reports 2020–2024 (Bursa Malaysia filings).
[9] KESM Industries Berhad, Quarterly Results Q2 FY2026 (Bursa Malaysia filing dated 10 March 2026).
[10] The Edge Singapore, “Sunright returns to profitability in 1HFY2026, with net profit of $1.4 mil” (13 March 2026). https://www.theedgesingapore.com/capital/results/sunright-returns-profitability-1hfy2026-net-profit-14-mil
[11] The Edge Singapore, “As interest moves to semiconductor value chain stocks, the STI continues consolidation” (24 April 2026). https://www.theedgesingapore.com/capital/right-timing/interest-moves-semiconductor-value-chain-stocks-sti-continues-consolidation
[12] Aehr Test Systems Inc, “Aehr Receives Record $41 Million Production Order from Lead Hyperscale AI Customer; Second-Half Bookings Exceed $92 Million” (April 2026). https://www.aehr.com/2026/04/aehr-receives-record-41-million-production-order-from-lead-hyperscale-ai-customer-second-half-bookings-exceed-92-million/
[13] Yahoo Finance, Sunright Limited (S71.SI) share-price and market data, retrieved 7 May 2026. https://finance.yahoo.com/quote/S71.SI/
[14] Yahoo Finance, KESM Industries Berhad (9334.KL) share-price and market data, retrieved 7 May 2026. https://finance.yahoo.com/quote/9334.KL/
[15] Grand View Research, “Outsourced Semiconductor Assembly And Test Services Market To Reach $67.92Bn By 2030” (press release). https://www.grandviewresearch.com/press-release/global-outsourced-semiconductor-assembly-test-services-market
[16] Virtue Market Research, “Wafer-Level Burn-In & Reliability Testing Market | Size, Overview, Trends, and Forecast | 2026–2030”. https://virtuemarketresearch.com/report/wafer-level-burn-in-reliabilit-testing-market
[17] Minichart, “KESM Industries Berhad Q2 2026 Financial Results: Revenue Growth, AI Chip Demand, and Profit Recovery” (10 March 2026). https://www.minichart.com.sg/2026/03/10/kesm-industries-berhad-q2-2026-financial-results-revenue-growth-ai-chip-demand-and-profit-recovery/
IMPORTANT DISCLAIMERS
This article is published for informational and educational purposes only. It does not constitute financial or investment advice, a recommendation, or a solicitation to buy, sell, or hold any securities. The author is not a licensed financial adviser under the Financial Advisers Act 2001 of Singapore, nor a licensed adviser under the Capital Markets and Services Act 2007 of Malaysia. This content is exempt from the requirements of the Singapore Financial Advisers Act pursuant to Regulation 34 of the Financial Advisers Regulations, as it is published in a generally available publication. This publication does not take into account the specific investment objectives, financial situation, or particular needs of any individual. Before making any investment decision, readers should consult a licensed financial or investment adviser in their relevant jurisdiction. Past performance is not indicative of future results.
No Warranty: While the data and analysis have been prepared in good faith from public sources believed to be reliable, no representation or warranty, express or implied, is made as to the accuracy, completeness, or timeliness of the information. The author accepts no liability for any loss arising from the use of this material.
Disclosure: The author may or may not hold positions in the securities discussed. No compensation has been received from any company mentioned in this article.
Most small-cap rallies overshoot the underlying business and the board's job in the moment is to do nothing without looking like they are doing nothing. Holding-company arithmetic catches up eventually. The question is whether the chair has the patience to let the multiple compress on its own schedule rather than chasing the narrative.
The SEA Analyst, thanks for highlighting Sunright. Interesting company and structure.
Sunright is new to me. At first glance, the cyclical risk is significant.
Sunright's profits and share price peaked around 2018 and 2021. This coincided with the peaks in semiconductor shortages.
Right now, earnings seem sustainable at least until the end of calendar 2026.
But there is a risk that the shortage ends and earnings collapse around calendar Q1'27.
I discuss why in detail here: https://angsanaanderson.substack.com/p/where-are-we-in-the-semiconductor?r=5rl2u5