
Tiong Woon: Singapore's Hidden Heavy Lift Champion Trading at Half Its Book Value
Most investors have never heard of Tiong Woon Corporation. That might be exactly why it's interesting.

Tiong Woon Corporation (SGX: BQM.SI) is one of the top 15 largest crane-owning companies in the world. It’s been in business for over four decades, it’s profitable, it’s growing, and it trades at roughly half its book value.
Here’s what caught my attention: the company just posted record revenue of S$163.5 million in FY2025, growing 14% year-on-year. Net profit hit S$19.2 million. And yet the market values the entire company at around S$183 million, less than half the S$322 million of net assets sitting on its balance sheet.
Let’s unpack why.
What Does Tiong Woon Actually Do?
Tiong Woon is an integrated heavy lift and haulage specialist. If you need to lift 3,600 tonnes of refinery equipment in India using a pair of ultra-heavy crawlers, or hoist a beam launcher frame onto the Pan-Island Expressway, these are the people you call.
The company operates through three segments, though one overwhelmingly dominates:
Heavy Lift and Haulage (98% of FY2025 revenue, S$159.9M): This is the core business: project planning and engineering, heavy lift execution using mobile, crawler, and tower cranes, heavy haulage with modular transporters and prime movers, rigging, jacking and skidding services, and barge transportation for oversized cargo. Revenue grew 15% from S$139.4M in FY2024 to S$159.9M in FY2025.
Marine Transportation (~1%): Sea transportation using tugs and barges. A small segment but one that has been recovering: fleet utilisation improved to 35% in FY2022 after bottoming at 31% in FY2021.
Trading (~1%): Authorised dealer for XCMG products in Southeast Asia and KATO crawler cranes in ASEAN, plus parts distribution and after-sales services. Strategically useful as it supports the core heavy lift business.
The fleet is massive: 600+ cranes and heavy lifting assets, with capacities up to 2,200 tonnes. In FY2025 the company added an XCMG XGC12000 (800T) crawler crane, further strengthening its ultra-heavy lift capabilities. Plus 359 transportation assets, prime movers, low beds, trailers, and marine vessels. The company owns yards and offices across 12+ countries.
Geographically, Singapore is the dominant market at 73% of FY2025 revenue (S$119.1M). India and Thailand each contributed 7% (S$11.9M each). The balance is spread across Indonesia, Brunei, the Middle East, and other regional markets. Singapore’s share has been fairly stable in the 73–78% range over recent years.
The Numbers: A Decade of Turnaround
The financial story is one of dramatic recovery and, more recently, acceleration
The downturn years (FY2016–FY2018)
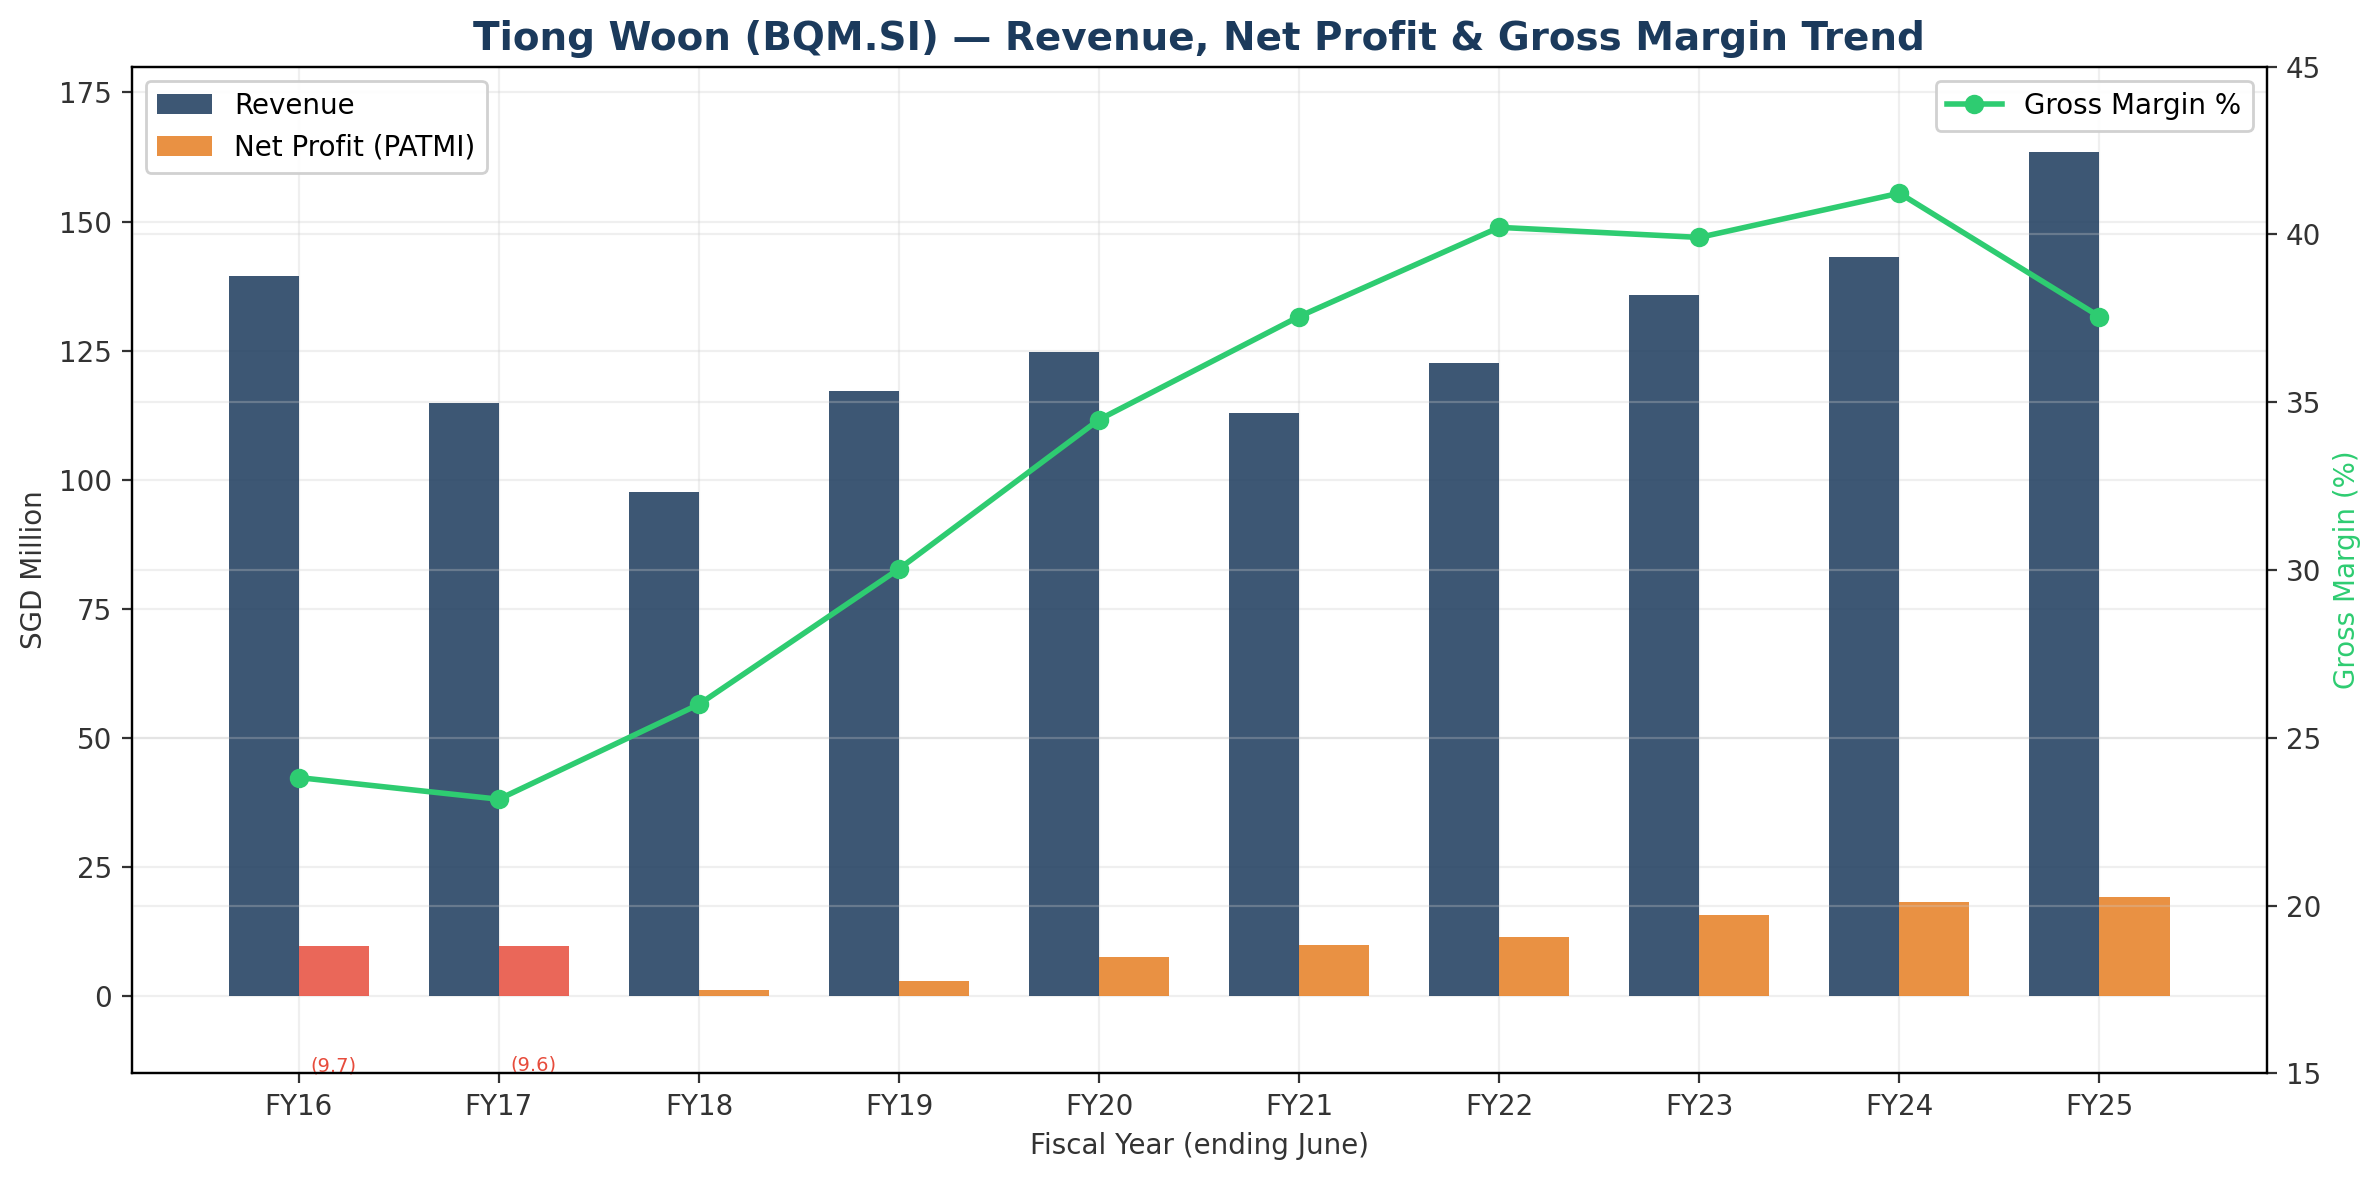
In FY2016–2017, Tiong Woon posted combined losses of nearly S$20 million. The oil and gas downturn hammered demand for heavy lift services. To make matters worse, the company took massive trade receivable impairments: S$9.8M in FY2016 and S$5.9M in FY2017, largely related to a long-outstanding receivable from Saudi Arabia that was eventually fully written off.
Revenue fell from S$139.4M in FY2016 to just S$97.7M in FY2018, the trough year. But even at the bottom, operating cash flow remained positive at S$23.9M, the underlying business was still generating cash despite the reported losses. This is an important nuance: the losses were driven more by impairments and below-the-line items than by operational cash burn.
The recovery (FY2019–FY2022)
FY2019 marked the inflection point. Revenue climbed back to S$117.2M and the company returned to profitability, albeit modestly (PATMI of S$2.9M, EPS of 1.27 cents). FY2020 saw revenue grow to S$124.7M despite the COVID-19 disruption, the company was able to continue operating in essential services sectors (oil and gas, marine, logistics) even during the Circuit Breaker.
Margins began expanding meaningfully. Gross profit margin improved from 26% in FY2018 to 35% in FY2020 and 40% in FY2022, driven by better pricing, improved fleet utilisation, and a focus on higher-value projects. The Heavy Lift and Haulage segment specifically saw margin improvement as the company invested in fleet management and cost control.
The acceleration (FY2023–FY2025)
The past three years represent the strongest financial performance in the company’s history:
FY2023: Revenue S$135.8M (+11% YoY), PATMI S$15.7M (+38%), gross margin 39.9%
FY2024: Revenue S$143.1M (+5%), PATMI S$18.2M (+16%), gross margin 41.2% (peak)
FY2025: Revenue S$163.5M (+14%), PATMI S$19.2M (+6%), gross margin 37.6%
A few things stand out from the numbers:
Margin trajectory: Gross margins expanded from 23% in FY2016 to a peak of 41.2% in FY2024. FY2025 saw a pullback to 37.6%, which the annual report attributes to project sales mix and higher indirect manpower costs. The 14% revenue growth only translated to 4% gross profit growth (S$59.0M to S$61.4M), which tells us the incremental revenue came at lower margins than the existing base.
Is this a temporary blip or the beginning of margin normalisation? The answer likely depends on fleet utilisation trends. Utilisation dipped slightly from 56% in FY2024 to 54% in FY2025, even as the fleet expanded from 543 to 600+ units. That 2-percentage-point decline, combined with higher overhead from a larger fleet, explains most of the margin compression.
Other operating expenses have been growing: S$36.8M in FY2025 vs S$34.3M in FY2024 and S$25.8M in FY2021. This line includes staff costs, which have risen as the company scaled up to 1,223+ employees. These costs are somewhat sticky, they don’t shrink quickly if demand softens.
Impairment losses have shrunk dramatically, from S$3.7M in FY2020 to S$0.9M in FY2025. The company has clearly cleaned up its receivables book.
Finance costs remain moderate at S$4.2M in FY2025, though they’ve been creeping up from S$2.8M in FY2022 as borrowings increased for the FY2025 capex cycle.
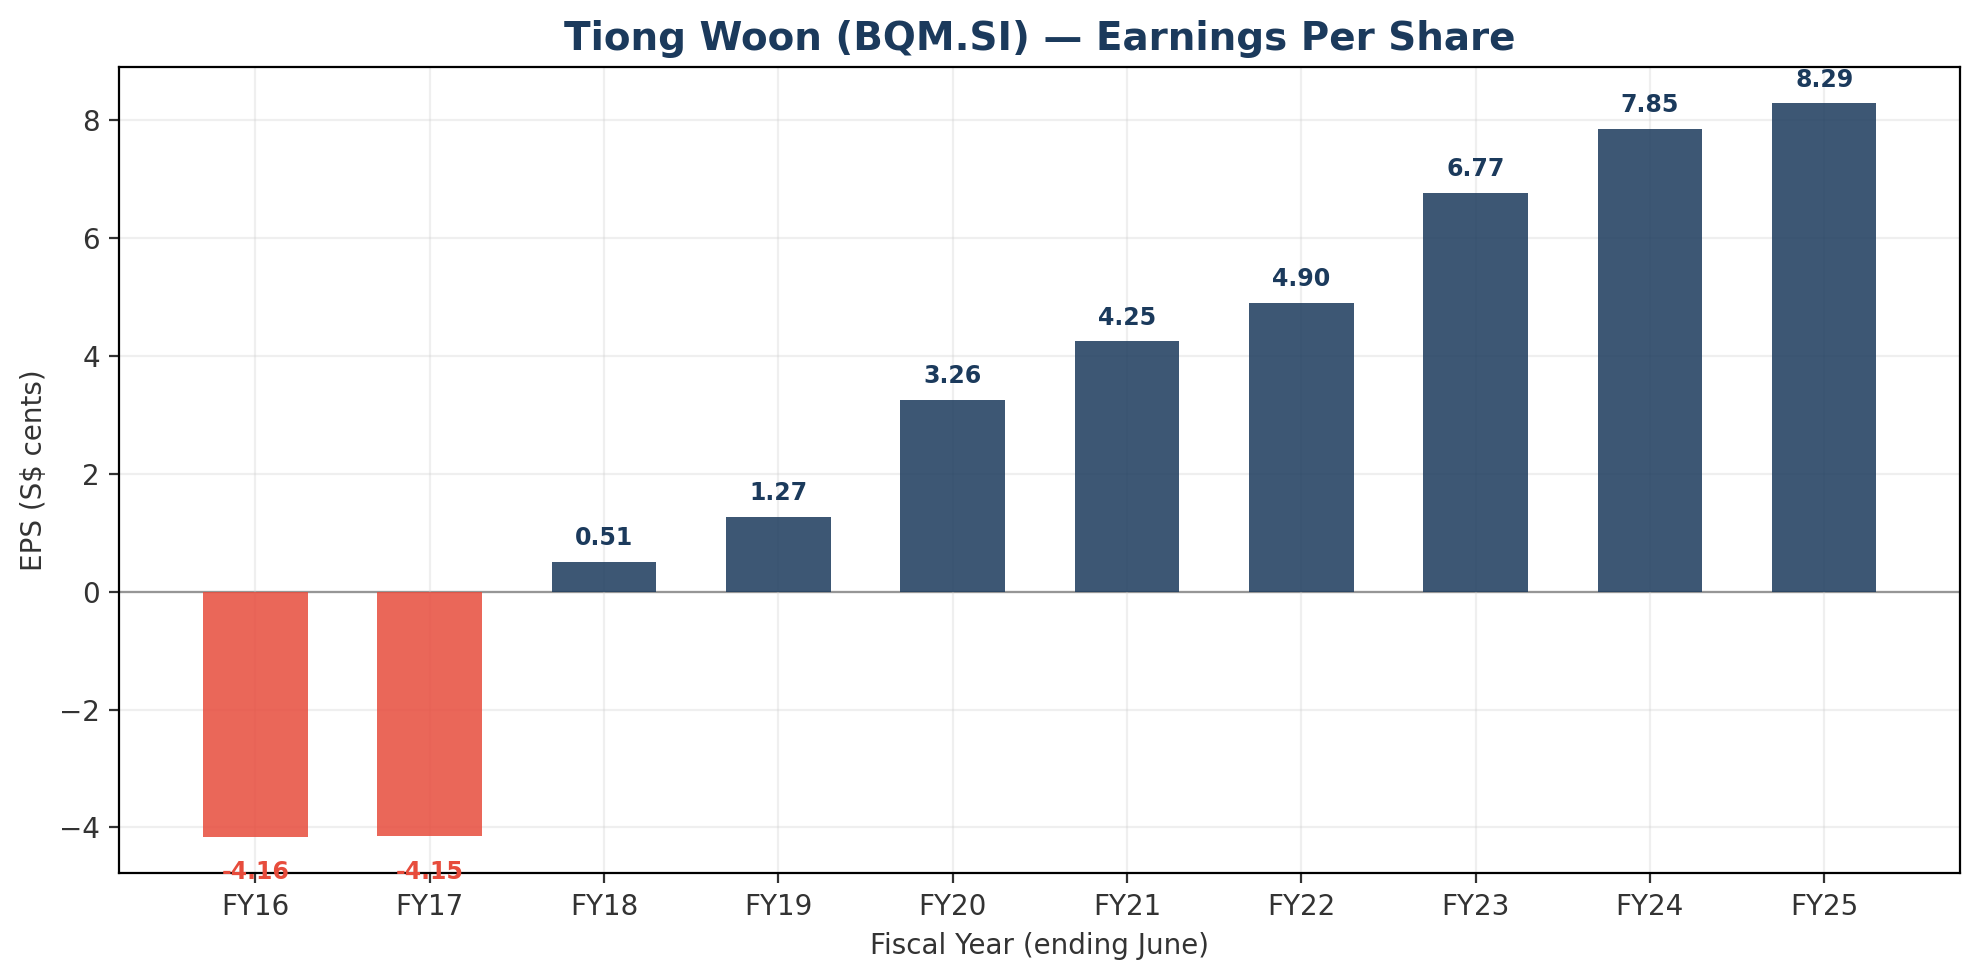
EPS has grown from a loss of 4.16 cents in FY2016 to a positive 8.29 cents in FY2025, a complete transformation. The 7-year EPS CAGR from FY2018’s 0.51 cents to FY2025’s 8.29 cents is approximately 49%, though this is from a depressed base.
Balance Sheet: The Hidden Strength
Here’s where it gets really interesting for value-oriented investors.
Asset composition
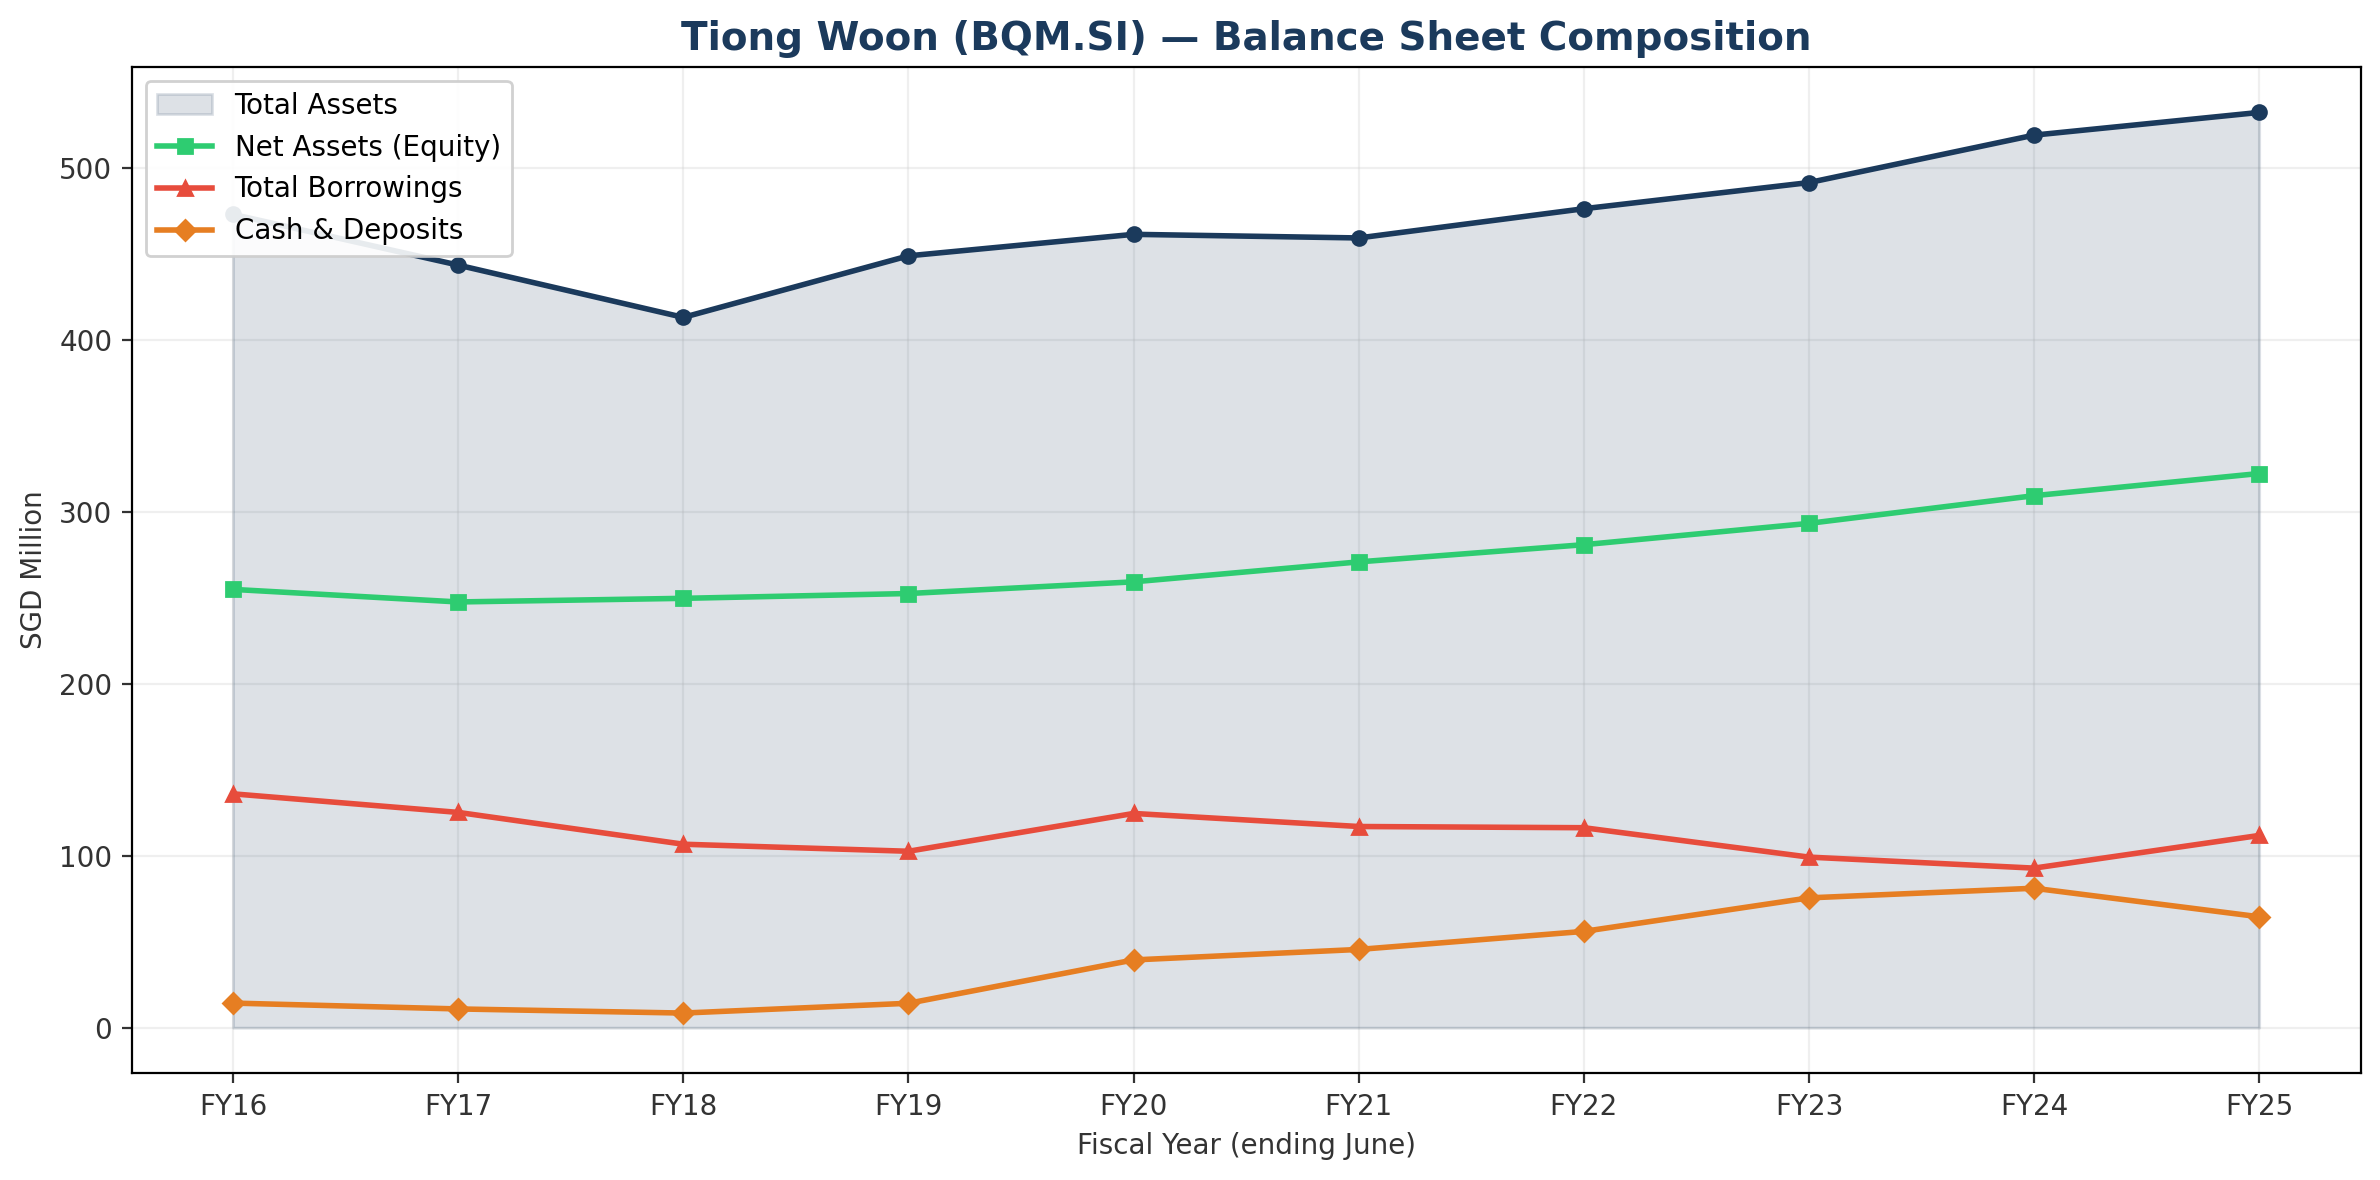
Total assets grew from S$413M in FY2018 to S$532M in FY2025. The balance sheet is dominated by Property, Plant and Equipment at S$387M. That’s cranes, heavy lifting equipment, yards, and other physical assets. PPE alone exceeds the entire market capitalisation (S$183M) by more than 2x.
Right-of-use assets add another S$11.7M, and cash and bank deposits stand at S$64.5M (down from S$81.1M in FY2024, reflecting the heavy capex year). Trade receivables of S$59.0M are up from S$53.0M in FY2024, consistent with the revenue growth.
Deleveraging story
The most impressive balance sheet trend is the deleveraging. Net gearing has declined from 0.48x in FY2016 to just 0.15x in FY2025. Here’s how that played out:
Total borrowings fell from S$136M in FY2016 to a trough of S$92.8M in FY2024, while net assets grew from S$255M to S$309M over the same period. In FY2025, borrowings increased to S$111.8M to fund the major fleet expansion (S$45.2M capex), but net gearing of 0.15x is still very conservative for an asset-intensive business.
The company’s borrowings are split between current (S$21.6M) and non-current (S$90.2M). The non-current portion increased significantly in FY2025, suggesting the fleet investments are being financed with long-term facilities, a sensible match of asset life to financing tenor.
Net assets
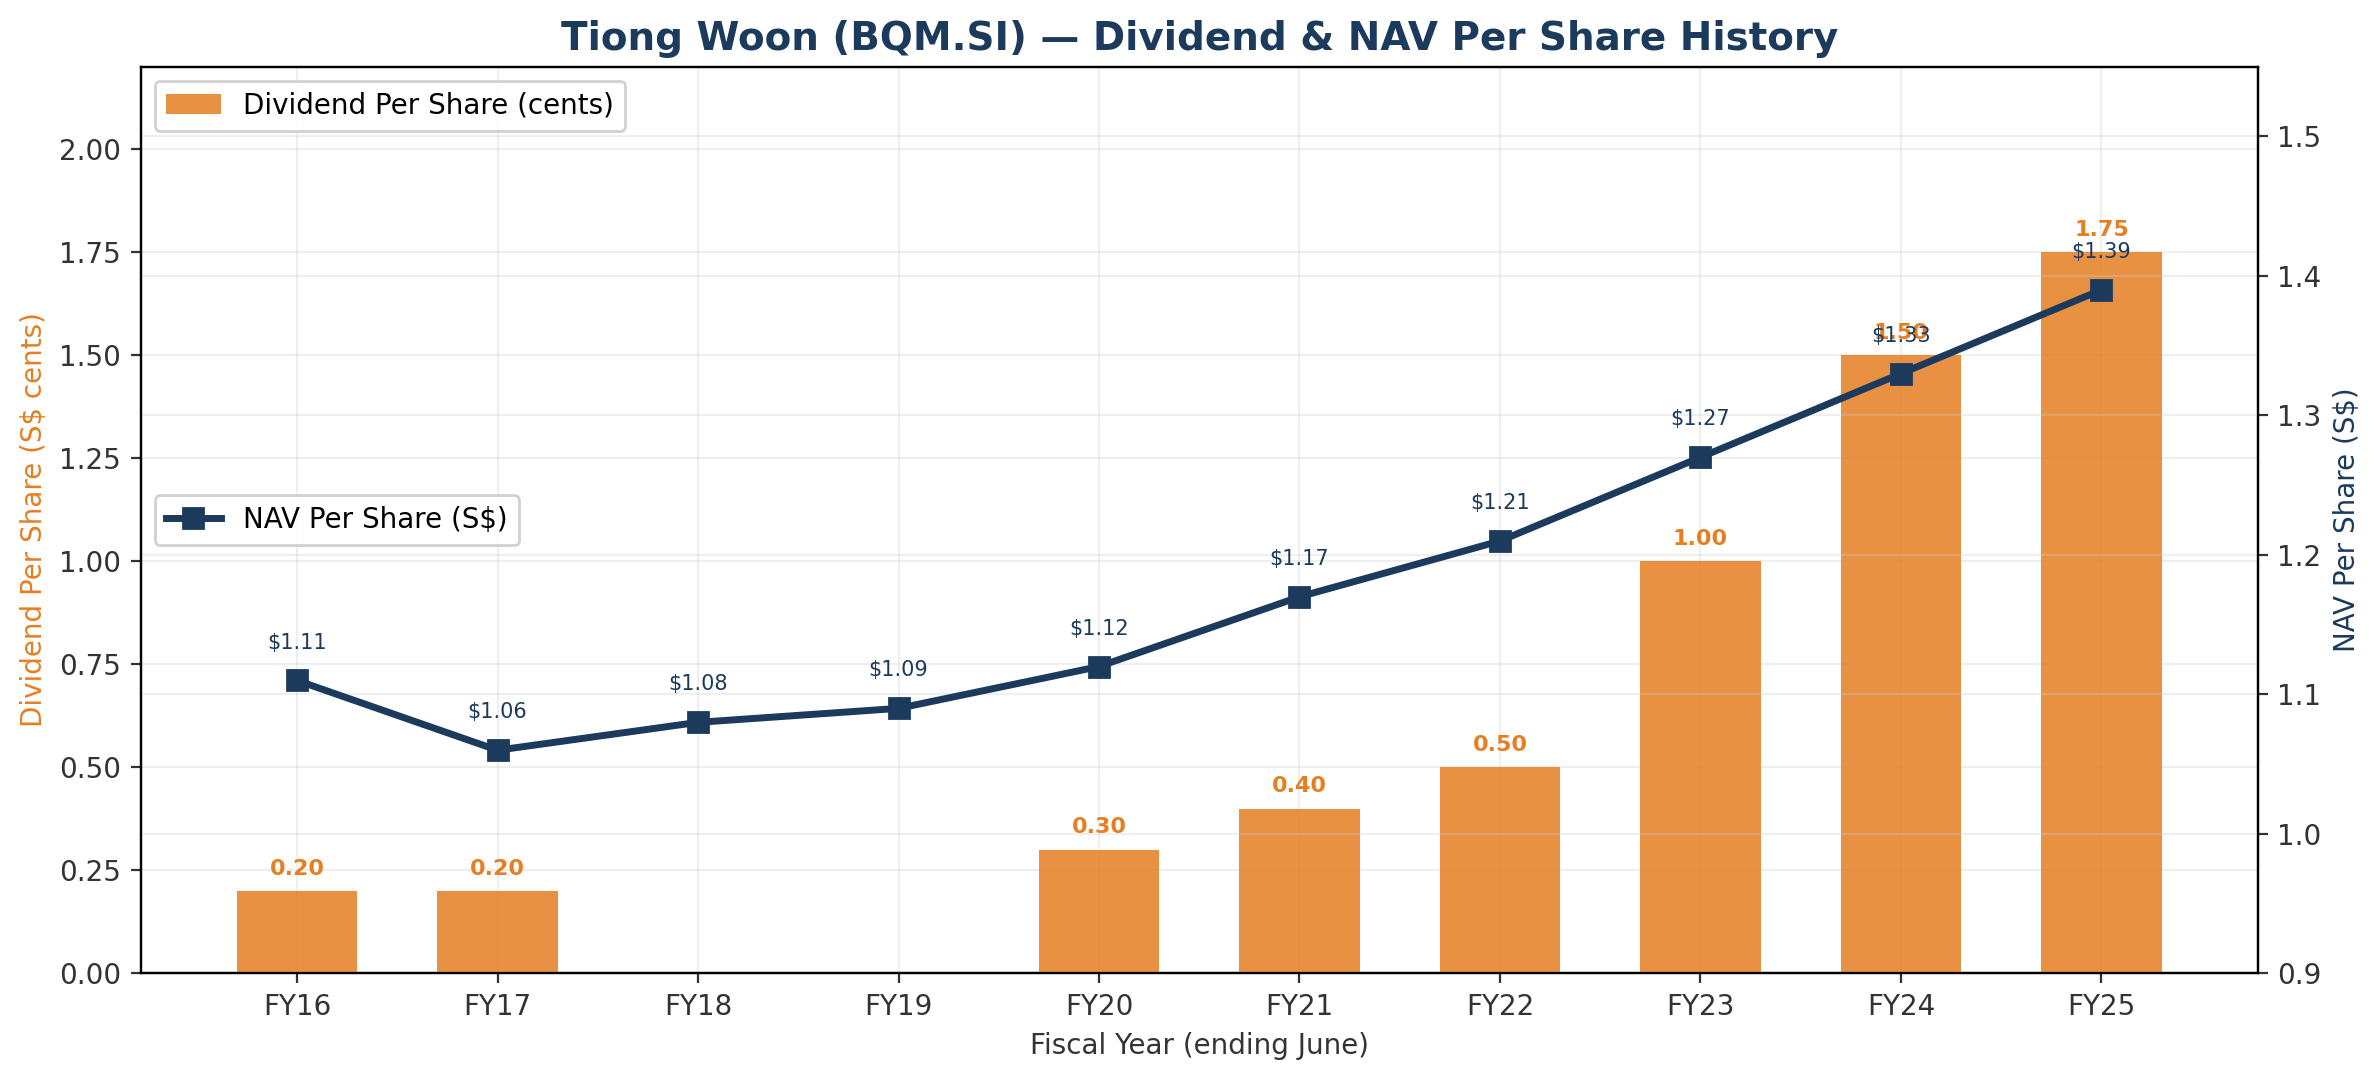
Net assets have grown steadily from S$247.6M in FY2017 to S$322.3M in FY2025, translating to NAV per share of S$1.39. This compares to a current share price in the S$0.60–0.81 range, meaning the stock trades at 0.43x–0.58x book value.
Now, specialised heavy lift equipment may not be worth full book value in a distressed sale. Cranes and modular transporters are expensive to transport and maintain, and buyer pools are limited. But the equipment is productive and generating returns, not sitting idle. And the consistent cash generation (see next section) validates the earning power of these assets.
Cash Flow: The Real Test
One of the most important tests for an asset-heavy business: does it actually generate cash? Or do the depreciation charges mask a business that’s barely earning its cost of capital?
Operating cash flow
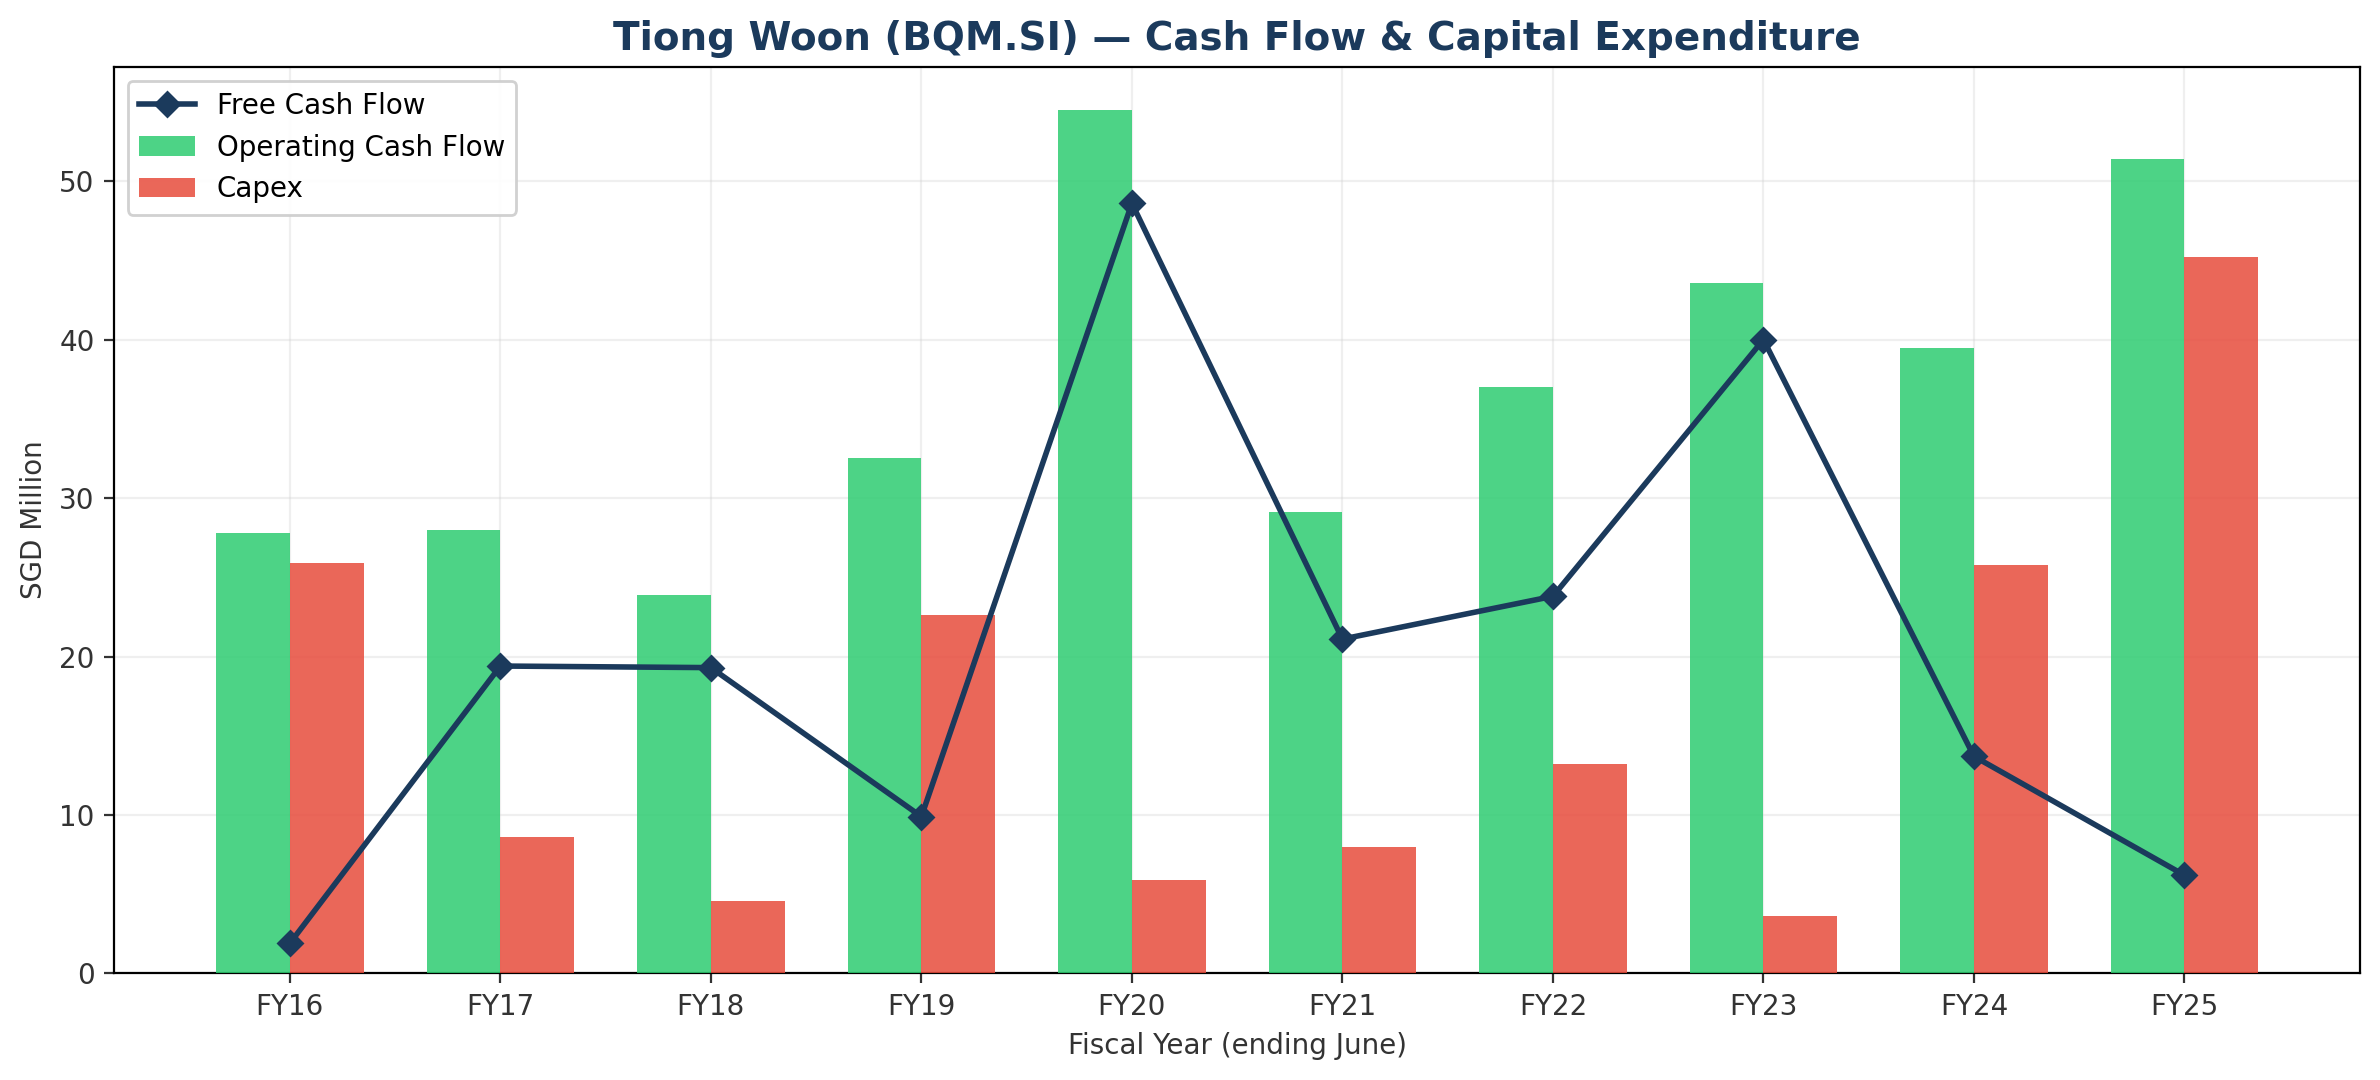
Operating cash flow has been consistently positive for the entire 10-year period, even during the loss years. OCF ranged from S$23.9M (FY2018, the trough) to S$54.5M (FY2020). FY2025 saw strong OCF of S$51.4M, up 30% from FY2024’s S$39.5M, driven by higher earnings and working capital improvements.
A key metric: depreciation consistently runs at S$30–35M per year (S$34.8M in FY2025, comprising S$33.9M on PPE and S$0.9M on right-of-use assets). The fact that OCF of S$51.4M comfortably exceeds depreciation means the business is generating real economic profit, not just accounting profit.
Capital expenditure cycles
Capex has been highly variable, ranging from just S$3.6M in FY2023 to S$45.2M in FY2025. This reflects the lumpy nature of fleet investment. Cranes are expensive assets purchased when specific growth opportunities justify them.
The FY2025 capex of S$45.2M is the highest in the company’s recent history and represents a major growth bet. The annual report highlights the addition of the XGC12000 (800T crawler crane) as a strategic investment to expand ultra-heavy lift capabilities. This is equipment that positions the company to compete for the largest projects in the region, the kind that previously would have gone to international players like Mammoet or Sarens.
The company partially offset the capex through disposal proceeds of S$8.8M (selling underutilised older equipment), bringing net investment to approximately S$36.4M.
Free cash flow
Free cash flow (OCF minus capex) has been positive in 9 of the 10 years, with only FY2025 essentially breakeven at S$6.2M due to the heavy investment year. The cumulative FCF over the 10-year period is approximately S$204M, which is remarkable for a company with a current market cap of S$183M, investors are essentially buying the entire company for less than one decade of free cash flow.
Dividend payments
Dividends paid have grown from zero (FY2018–2019) to S$3.5M in FY2025. Even at the current payout level, dividends represent less than 7% of OCF, leaving substantial capacity for further increases or investment.
Dividends: Small but Growing Fast
Tiong Woon suspended dividends during the downturn years (FY2018–2019) but has reinstated and progressively increased them:
FY2020: 0.30 cents
FY2021: 0.40 cents (0.30 regular + 0.10 special)
FY2022: 0.50 cents (0.35 + 0.15 special)
FY2023: 1.00 cent (0.40 + 0.60 special)
FY2024: 1.50 cents (0.60 + 0.90 special)
FY2025: 1.75 cents (final only, subject to AGM approval)
That’s nearly a 6x increase in six years, from 0.30 cents to 1.75 cents. At a current price of S$0.76 (midpoint), the trailing yield is approximately 2.3%.
The payout ratio remains conservative at roughly 19% of earnings. With EPS of 8.29 cents and DPS of 1.75 cents, the company is retaining over 80% of earnings for reinvestment. There’s substantial room to grow the dividend further without straining the balance sheet.
The progressive introduction of special dividends alongside regular dividends is a positive signal. It suggests management is willing to return capital to shareholders when results are strong, while maintaining flexibility by not locking in unsustainably high regular dividends
.Competitive Position and Industry Context
Tiong Woon’s competitive positioning is strengthened by several factors:
Fleet scale: With 600+ cranes ranging from small mobile units to 2,200T capacity crawlers, the company can handle projects of virtually any scale. This breadth matters because customers increasingly prefer one-stop solutions rather than engaging multiple contractors.
Track record: Decades in the business, with the kind of safety and execution record that gets you invited to bid on complex projects. Recent showcase projects include the PIE Beam Launcher Frame installation (using a 900T mobile crane and 10-axle modular transporter), a 3,600-tonne combined lift at the Numaligarh Refinery in India (deploying 1,600T and 2,200T crawler cranes to install four reactors), and heavy lifting works at Jurong Island petrochemical facilities.
Only listed pure-play in SEA: After Tat Hong Holdings was taken private in 2018, Tiong Woon became the only publicly listed pure-play heavy lift specialist in Southeast Asia. Most competitors, Mammoet (Netherlands), Sarens (Belgium), Moh Seng, Pollisum, Hiap Tong, are private. This is both a competitive dynamic (less public scrutiny on competitors) and a scarcity factor for investors who want exposure to this niche.
Mammoet MoU (FY2024): The company signed a Memorandum of Understanding with Mammoet, the global leader in heavy lift. While MoUs don’t always materialise into revenue, a partnership with the world’s largest heavy lift company could unlock projects that neither party could win alone.
The industry backdrop is favourable. Singapore’s infrastructure pipeline (Tuas expansion, MRT network extensions, petrochemical investments on Jurong Island) represents multi-decade demand. The broader SEA mobile crane market is projected to grow at 8.4% CAGR through 2029.
Ownership and Governance
Tiong Woon is family-controlled. The Ang family holds approximately 39% through Ang Choo Kim & Sons Pte. Ltd. Executive Chairman Ang Kah Hong has led the business since its early days; CEO Ang Guan Hwa (appointed 2020) represents the next generation.
The family’s significant stake creates alignment - they’re eating their own cooking. But it also means limited free float (roughly 50% retail), which constrains liquidity and institutional participation.
The board includes two independent directors who chair the Audit, Nominating, and Remuneration committees, meeting SGX’s governance requirements. Capital allocation decisions over the past decade have been sensible: deleveraging during the downturn, preserving cash, then investing aggressively into the upcycle.
Valuation: Why Is It So Cheap?
Let’s look at the numbers from multiple angles.
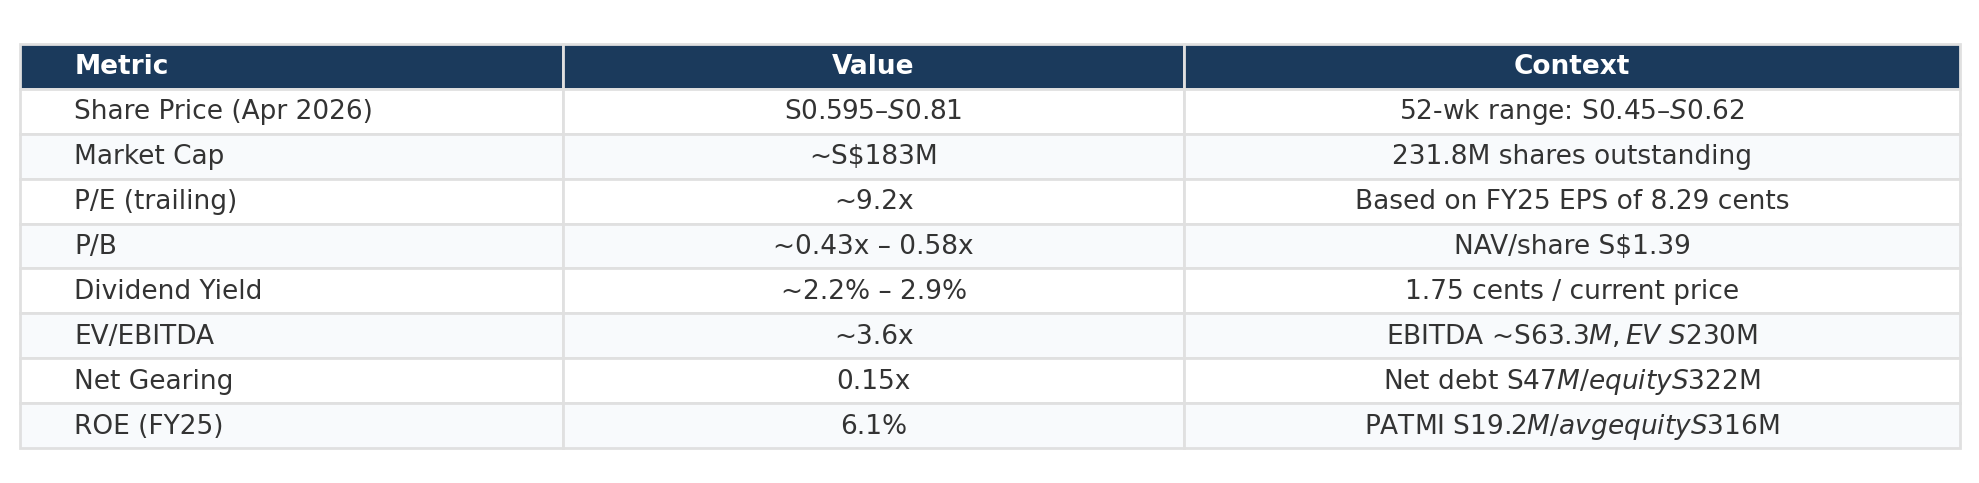
P/E of ~9.2x (based on FY2025 EPS of 8.29 cents at a ~S$0.76 midpoint). For a company that’s delivered 7 consecutive years of profit growth and just posted record revenue, this is modest. Regional industrial companies on SGX typically trade at 10–15x earnings.
P/B of ~0.43x–0.58x. Net asset value per share is S$1.39 versus a share price of S$0.60–0.81. The stock would need to roughly double to reach book value. While specialised equipment may carry an asset-realisation discount, the earning power of these assets is being demonstrated year after year.
EV/EBITDA of ~3.6x. EBITDA from first-party data is approximately S$63.3M (PBT S$24.4M + interest expense S$4.2M + PPE depreciation S$33.9M + ROU depreciation S$0.9M). Enterprise value is roughly S$230M (market cap S$183M + total borrowings S$111.8M – cash S$64.5M). At 3.6x EV/EBITDA, the company still trades at a significant discount to typical industrial multiples of 6–8x.
Dividend yield of ~2.3%. Not a screaming yield, but the nearly 6x growth over six years suggests this will continue climbing. If DPS reaches 3.0 cents in the next 2–3 years (plausible at a 19% payout ratio with modest earnings growth), the yield on today’s price would be ~4%.
Why the discount? Several structural factors likely explain it:
Small market cap (~S$183M) keeps it below the radar of most institutional mandates
Family’s 39% stake reduces free float to ~50%
“Boring” industrial sector that doesn’t attract growth or thematic investors
Cyclicality risk. Investors remember the FY2016–2017 losses
Limited sell-side coverage for a micro-cap SGX name
For investors who can look past these structural factors, the valuation gap between intrinsic value and market price looks compelling.
What Could Go Right (and Wrong)
The bull case rests on:
Singapore’s multi-decade infrastructure pipeline sustaining demand
The XGC12000 investment unlocking ultra-heavy lift projects at premium margins
India and Middle East scaling to 15–20% of revenue
Continued deleveraging and dividend growth
A potential re-rating as the market recognises the sustained earnings improvement
If EPS reaches 10–12 cents by FY2027–28 and the market assigns a more reasonable 12x P/E (still below typical SGX industrial multiples), that would imply S$1.20–S$1.44 per share. Even a modest re-rating to 0.7x P/B would yield S$0.97.
The bear case centres on:
A macro or sector-specific slowdown hitting Singapore infrastructure spending
The FY2025 margin compression (41% → 38%) continuing as competition intensifies
Fleet utilisation declining from 54% towards the 48% levels of FY2022–23
The S$45M capex not generating adequate returns if demand softens
Currency risk from multi-country operations
In a downturn scenario, EPS could revert to 3–4 cents (the FY2020–21 range), and the stock could trade down to S$0.40–0.50 at 10–12x depressed earnings.
The base case sits somewhere in between: continued but moderating growth, margins stabilising in the 36–39% range, EPS of 8–10 cents, with the stock gradually re-rating as the dividend grows and the earnings track record lengthens.
The Bottom Line
Tiong Woon is a well-run, family-controlled industrial company with a 45-year track record, trading at a significant discount to its tangible asset value. The improving earnings trajectory, conservative balance sheet, and growing dividends all point in the right direction.
The key risk is cyclicality. This business has been through very tough times. The FY2016–2017 losses demonstrate what happens when demand turns. But the balance sheet is materially stronger today (net gearing 0.15x vs 0.48x), the receivables book is cleaner, and the company has a larger, more capable fleet positioned for the infrastructure upcycle.
At 0.5x book value, 9x earnings, and 3.6x EV/EBITDA, you’re getting a lot of asset and earning power for the price. The cumulative free cash flow over the past decade (S$204M) exceeds the current market cap (S$183M). That’s the kind of number that makes value investors pay attention.
This is a stock that doesn’t show up on most screens. It’s too small for institutions, too boring for retail momentum chasers, and too niche for thematic funds. Sometimes that’s exactly where the opportunities are.
All financial data extracted directly from publicly available annual reports filed with SGX. Market data from public financial data providers as of April 2026..
IMPORTANT DISCLAIMERS
General Disclaimer: This article is published for informational and educational purposes only. It does not constitute financial advice, a recommendation, or a solicitation to buy, sell, or hold any securities. The views expressed are based on publicly available data from Tiong Woon Corporation Holding Ltd’s SGX filings and publicly accessible market data, and may not reflect the most current developments.
Not Licensed Financial Advice: The author is not a licensed financial adviser, and this publication is not issued by a holder of a Capital Markets Services Licence under the Securities and Futures Act 2001 of Singapore. This content does not fall within the definition of “financial advisory service” under the Financial Advisers Act 2001 of Singapore. Readers in Singapore should note that this content is exempt from the requirements of the Financial Advisers Act pursuant to Regulation 34 of the Financial Advisers Regulations, as it is published in a generally available publication.
MAS Compliance Notice: In accordance with the Monetary Authority of Singapore’s guidelines, this publication does not take into account the specific investment objectives, financial situation, or particular needs of any individual. Before making any investment decision, you should consult a licensed financial adviser who can provide advice tailored to your personal circumstances. Past performance of any security discussed herein is not indicative of future results.
No Warranty: While the data and analysis have been prepared in good faith from public sources believed to be reliable, no representation or warranty, express or implied, is made as to the accuracy, completeness, or timeliness of the information. The author accepts no liability for any loss arising from the use of this material.
Disclosure: The author may or may not hold positions in the securities discussed. No compensation has been received from any company mentioned in this article.