

Short-form deep dive, distilled analysis, ~15 mins read
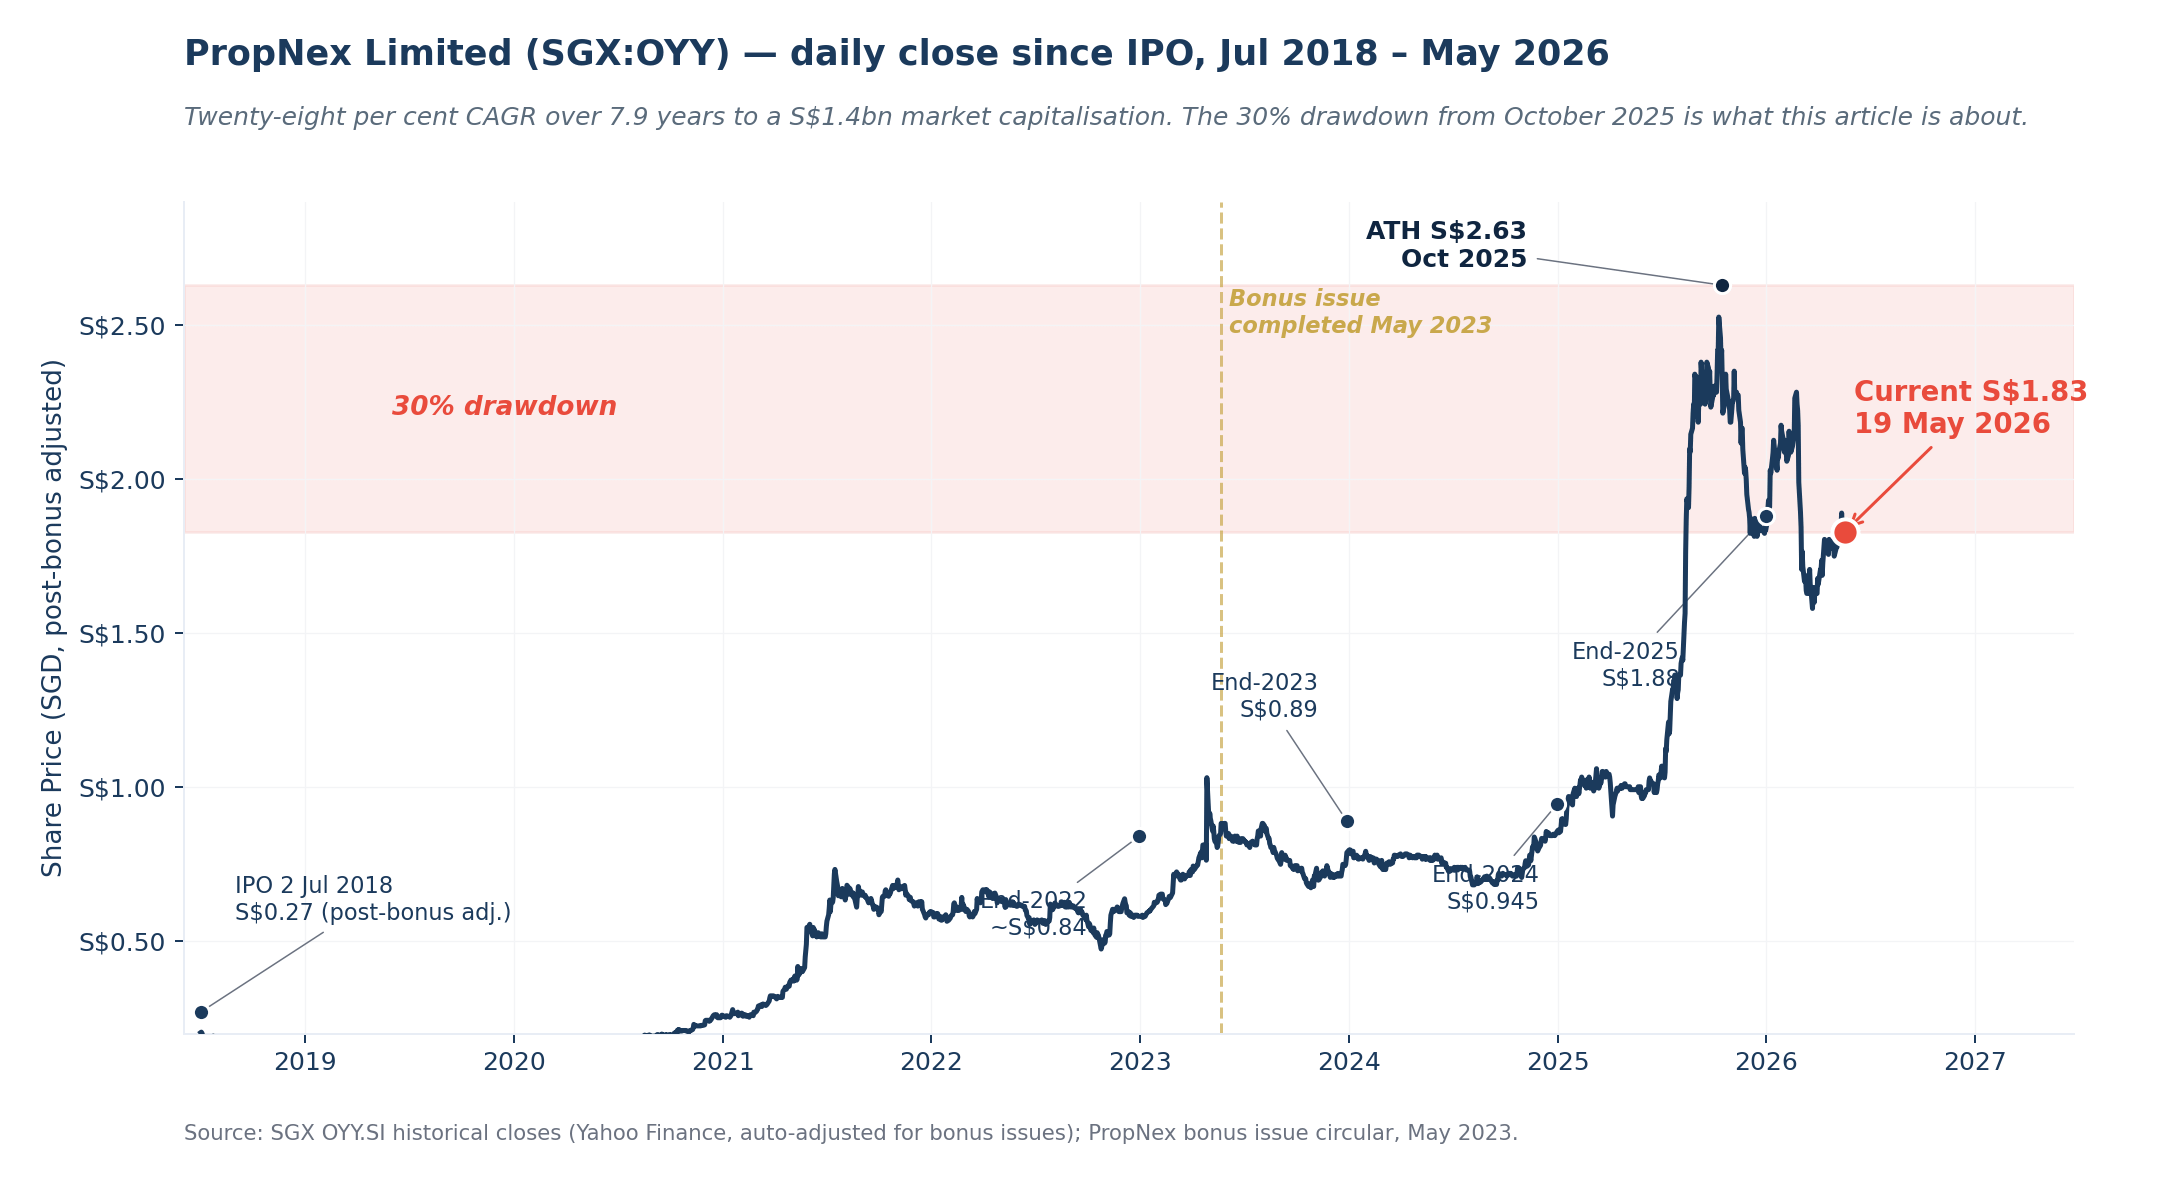
In October 2025, PropNex Limited (SGX:OYY) traded at S$2.63 [3]. On 19 May 2026 it closed at S$1.83 [3]. Seven months, a 30% drawdown, and the market has settled on a clean explanation. New private home launches in Singapore are guided down 17% in 2026. Project marketing commissions are PropNex’s largest revenue line. The market has done the obvious arithmetic, marked the stock down, and moved on.
That arithmetic is incomplete.
There are 13,500 Housing Development Board flats becoming eligible to be sold in 2026. They were bought five years ago at S$400,000 to S$600,000. Their current market value is 30% to 50% higher. The five-year minimum occupation period (the MOP, in Singapore property parlance) is the gate the government places between purchase and resale to deter speculation. When MOP releases, owners gain the legal right to monetise. Most do not sell immediately. But a meaningful share do, and most of those buy something else. The transaction is rarely a single sale; it is a chain. One household decision generates an HDB seller-side commission, a private buyer-side commission, and sometimes a rental commission while the private completes. Up to three fees from a single MOP exit.
This year’s MOP cohort is 69% larger than last year’s. That number, 13,500 versus 8,000 in 2025, is not a forecast. It is a mechanical consequence of when those flats were completed, which was the 2020 to 2021 COVID-era construction acceleration. It cannot be revised away.
PropNex earns from six segments. New launches were 39% of FY2025 revenue. The other 61% — private resale, HDB resale, rental, landed, and commercial — feeds directly off the MOP-driven upgrader chain. The market is pattern-matching to “launches down equals PropNex down” without doing the segment-level arithmetic.
This article makes the case for the franchise: what PropNex is, why it compounds, and why the market’s peak-cycle read deserves scrutiny. It stops short of the verdict — the precise FY2026 earnings range, the valuation scenarios, and the complete risk register belong to the longer analysis here.
Twenty-six years from one-man shop to S$1.4bn franchise
PropNex was founded in November 2000 by Ismail Gafoor, who is today executive chairman. The first decade was unglamorous: PropNex was one of several mid-sized Singapore agencies competing against ERA, OrangeTee, HSR and others, none of them dominant. The inflection arrived in 2010 with the formation of the Council for Estate Agencies, which tightened licensing requirements for both agencies and individual salespersons. For a fragmented industry, this raised the cost of legitimacy. PropNex spent the following ten years building a training and compliance infrastructure that turned this cost into an entry barrier for new competitors.
The SGX listing on 2 July 2018 priced at S$0.535 per share pre-bonus. On a post-bonus-adjusted basis, the IPO price is approximately S$0.27. The listing gave PropNex a currency for incentive grants and forced disclosure that strengthened developer credibility. The May 2023 bonus issue (one-for-one, doubling the share count to 740 million) deepened liquidity. All per-share figures in this article are restated post-bonus.
The most consequential recent event was the 2023 succession from Ismail Gafoor to Kelvin Fong as chief executive officer. Fong had spent his career at PropNex and rose internally from agency leader to deputy CEO to CEO. Gafoor moved to executive chairman with responsibility for strategy and capital allocation. This was a structured handover from a founder to an internal successor; not a reactive external hire. The founder remains in the building, the agency leadership layer remains intact, and the firm’s operating model was not disturbed.
The compound since IPO is steady rather than explosive. The 2018 IPO price of S$0.27 (post-bonus adjusted) versus today’s S$1.83 [3] represents roughly a 28% CAGR over 7.9 years, before the dividends paid along the way. Most of this return is franchise growth, not multiple re-rating.
What you actually own at S$1.83
PropNex is not a property company in any conventional sense. It does not own development sites. It does not carry inventory. It has S$1.6 million of fixed assets against S$1,116 million of FY2025 revenue. The economic engine is an asset-light intermediary at scale. PropNex’s licensed estate agency contracts with 14,333 self-employed salespersons [6], who pay PropNex a share of every commission they earn. PropNex’s share averages 12% to 14% across all transactions. There is no salary line for the salesforce because there are no salaries.
What this means in practice: when you buy a share of PropNex, you are not buying a slice of property or a slice of inventory. You are buying a slice of a business that takes a small cut of every property transaction one of its agents closes. The more agents the company has, and the more property changes hands in Singapore, the more cuts get taken. The capital required to add the next agent is essentially zero. This is the rare combination that makes an asset-light intermediary worth a meaningful premium to book value when it has scale, and worth very little when it does not. PropNex is at the scale end.
The six-segment FY2025 revenue mix matters because the cycle thesis turns on it.
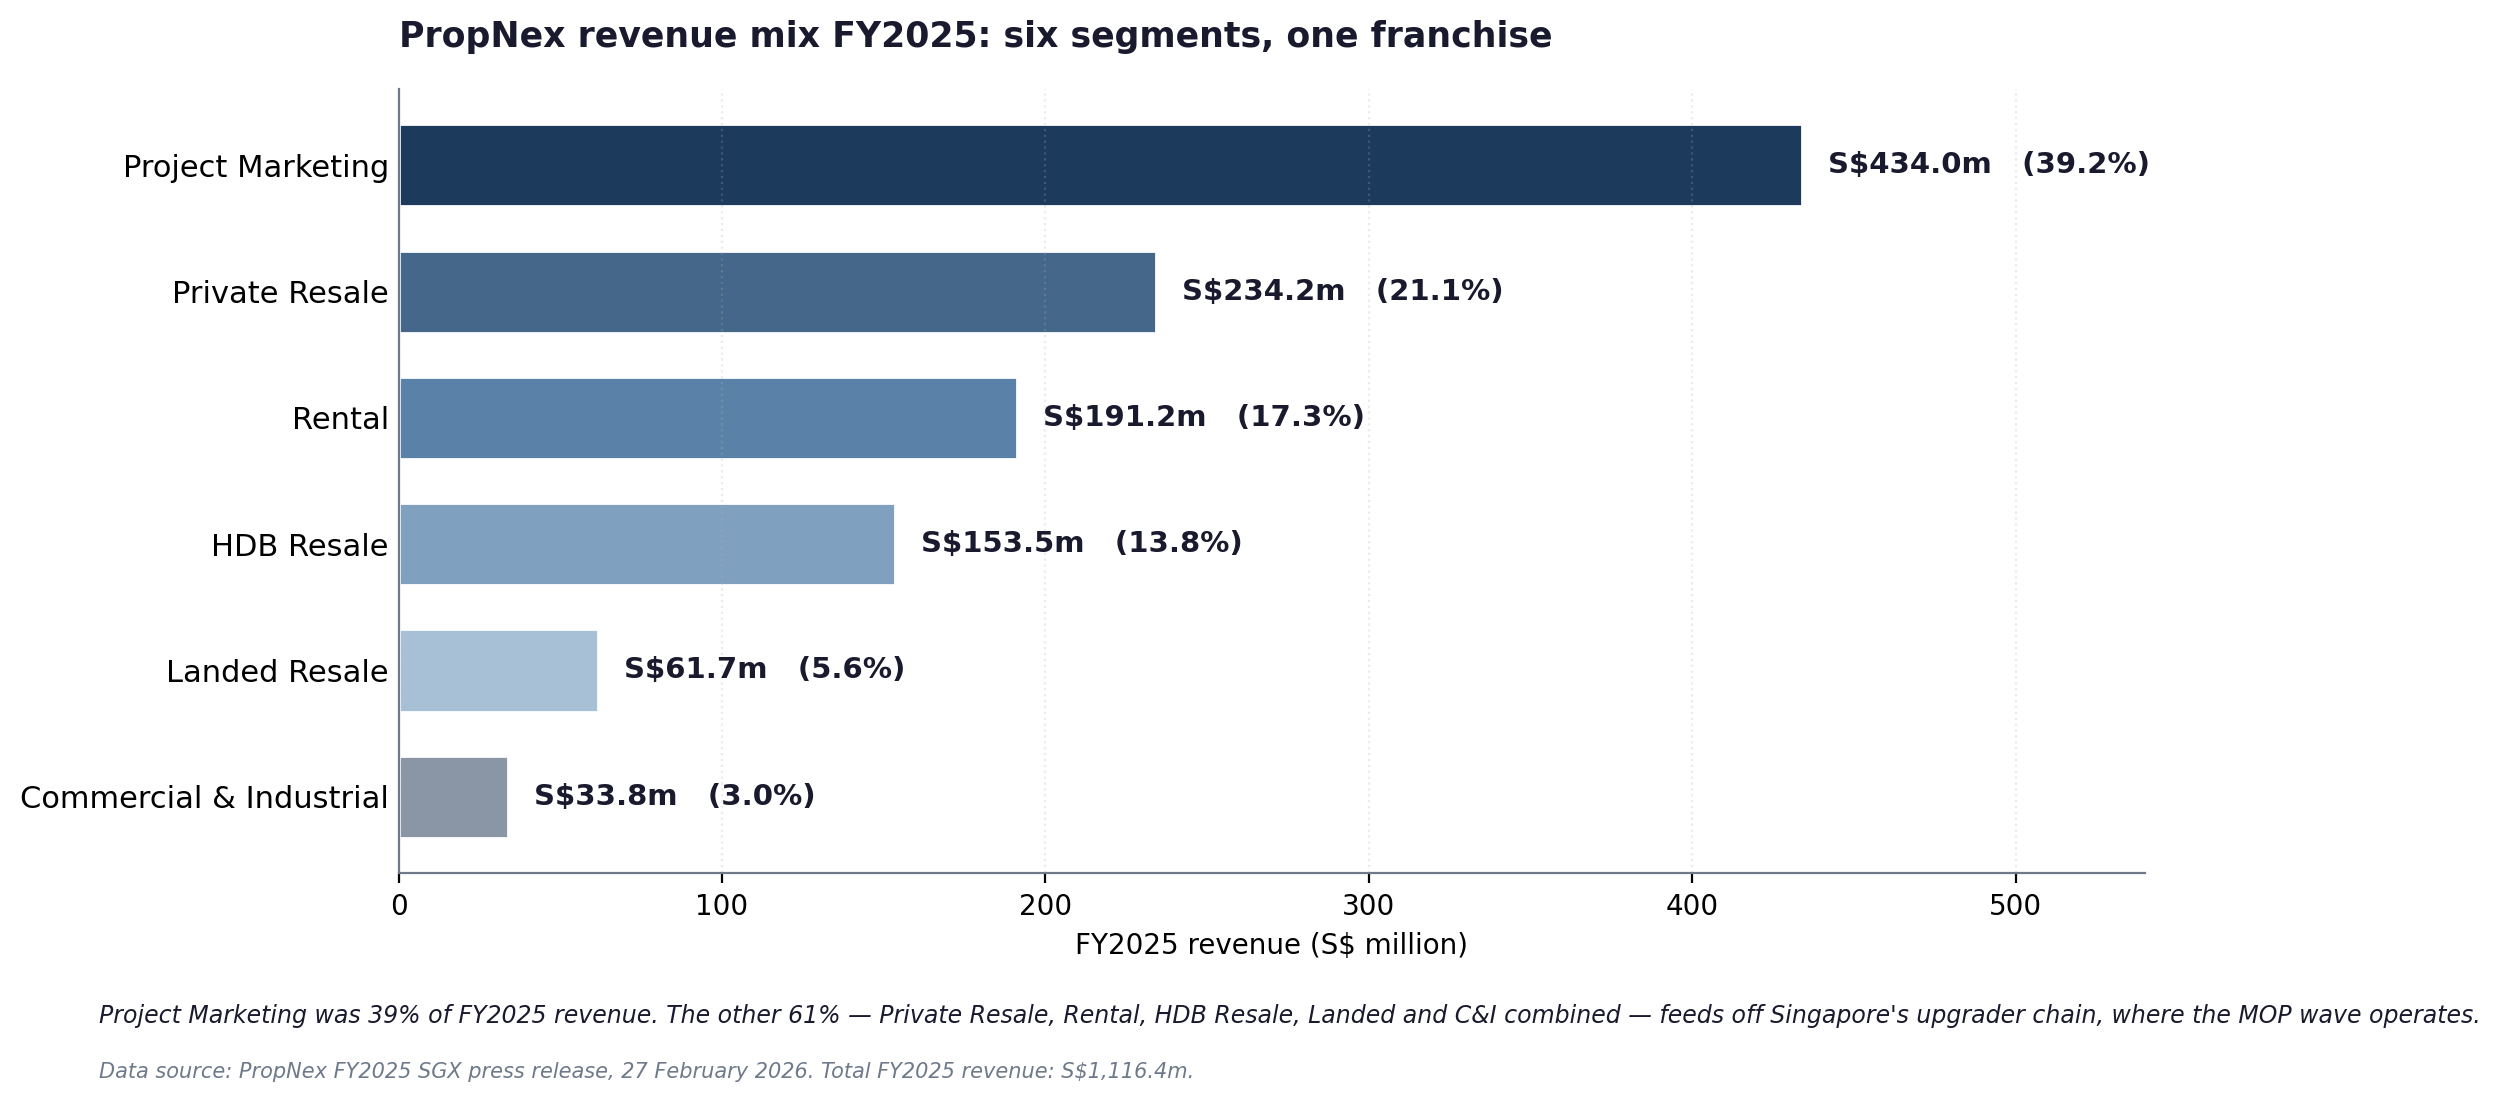
Project Marketing was S$434 million (39%), Private Resale S$234 million (21%), Rental S$191 million (17%), HDB Resale S$153 million (14%), Landed Resale S$62 million (5%), and Commercial and Industrial S$34 million (3%). The market is anchored on Project Marketing because new launches are guided down 17% in 2026. The other 61% of revenue is where the upgrader chain operates.
International operations (Indonesia, Malaysia, Vietnam, Cambodia, Australia) are immaterial to the investment case. PropNex is functionally a pure Singapore residential agency.
Why the largest agency keeps getting larger
PropNex has 14,333 agents as at 12 May 2026 [6]. ERA Realty Network, the second-largest, has 8,891 [6]. Huttons has 5,760 [6]. OrangeTee has 3,163 [6]. PropNex is 1.6 times the size of its nearest competitor and the gap is widening, not narrowing. Total registered salespersons in Singapore are approximately 37,467, so PropNex employs nearly 38% of the industry [6].
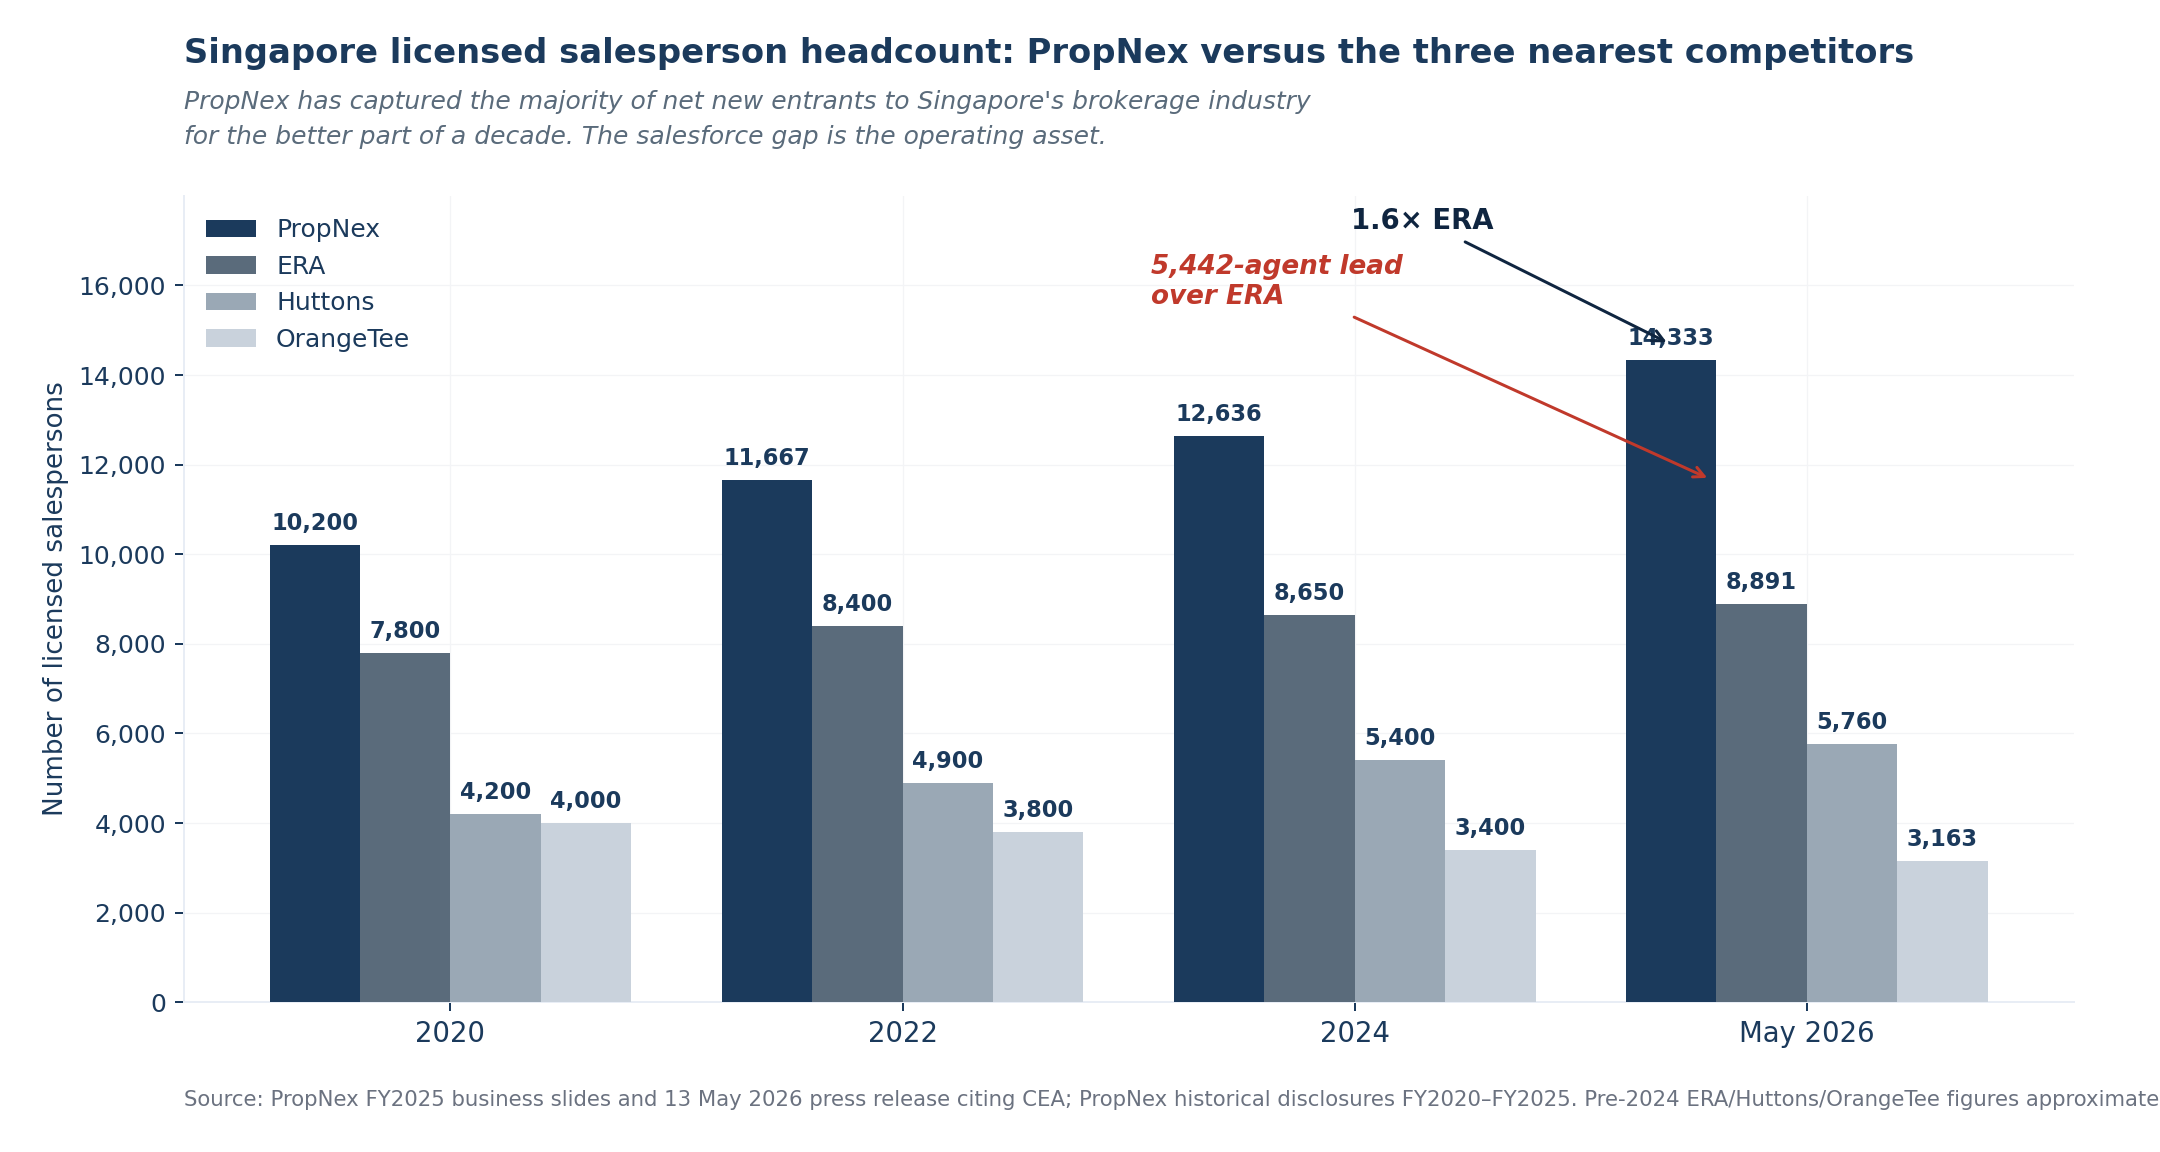
The salesforce gap is the moat. A new agent surveying Singapore’s brokerage options sees PropNex’s project marketing pipeline (over half of FY2025 new launches were PropNex-marketed) as a steady inflow of inbound leads that flow to its own agents. New agents at PropNex earn more in their first eighteen months than at smaller agencies because they have lead access. This attracts more agents, which wins more project mandates, which generates more leads. It is a flywheel that has compounded for ten years.
There is also a relationship layer that is harder to see from outside. When a Singapore developer launches a new private project, they typically appoint two to four marketing agencies. PropNex sits on the list for the vast majority of major launches because the relationships have been built across many years and many launches. The developers know, from track record, that PropNex’s salesforce can clear 500 to 1,000 units in a launch weekend. PropNex has consistently been the lead or co-lead marketing agency at the largest private residential launches each year, including most of the major FY2025 and 1Q FY2026 launches. This is not a relationship you can buy with a marketing budget. It takes a decade.
ERA’s salesforce of 8,891 is broadly the same range as it was five years ago. The market is consolidating in PropNex’s favour, not against it.
The competitive battle is active — and PropNex is winning it on net. The Singapore agency industry is in a visibly active recruitment phase, and a fair read of the moat case has to acknowledge both sides. In March 2026, ERA’s CEO Marcus Chu launched the “ERA +1 initiative” — each ERA agent asked to recruit one newcomer this year — and ERA disclosed at the same event that 54% of its new agent joiners in 2025 came from PropNex; a former PropNex top earner (Rayne Chua) joined ERA in February 2026 with approximately 80 agents under her [16]. Two months later, PropNex announced the return of Adrian Lim, co-founder of PropertyLimBrothers, alongside 37 PLB salespersons — a homecoming for Lim, who had been a top-performing PropNex leader from 2010 to 2022 [17]. The net result: PropNex’s CEA-registered salesforce grew from 14,202 in February 2026 to 14,333 on 12 May 2026 [6], while ERA’s count declined from 8,828 (February 2025) to 8,427 (January 2026). The salesforce gap has widened, not narrowed. The competitive battle is real and active; PropNex is winning it on net.
PropNex’s overall market share across all segments was 62.5% in FY2023 (the most recent Frost & Sullivan number) [7] and has remained in a similar range through FY2025 per PropNex’s own business-slide commentary. By segment, PropNex held 65.8% of private resale, 64.7% of HDB resale, 49.7% of landed resale, 47.9% of new launches, and 35.9% of private leasing [7].
One framing point that protects the franchise: Singapore residential transactions are predominantly agent-mediated. By our analytical estimate, roughly 85% to 90% of HDB resale and 90% to 95% of private resale clear through a licensed estate agent rather than directly between owner and buyer. The structural reasons are genuinely Singapore-specific — HDB regulatory complexity (CPF disbursements, Ethnic Integration Policy quota checks, valuation procedures), the per-transaction stake at S$1.5m-plus median private prices, and active CEA professionalisation since 2010. The for-sale-by-owner channel exists but is small.
What that scale advantage looks like in dollars. ERA's listed parent is APAC Realty Limited (SGX:CLN), which filed its FY2025 results in February 2026 and provides a clean audited side-by-side. PropNex's revenue is 1.65× APAC Realty's (S$1,116m versus S$676m). PATMI is 3.42× (S$70m versus S$21m), because PropNex's larger scale spreads overhead across roughly twice the revenue base — net margin of 6.3% versus 3.0% [13]. The dividend comparison cuts two ways and is worth stating precisely. PropNex pays 9.50 cents per share against APAC Realty's 4.50 cents — a 2.11× gap in absolute per-share payout. But APAC Realty trades at roughly a third of PropNex's share price (S$0.555 versus S$1.83), so on a yield basis the smaller company is ahead: APAC Realty's trailing yield is about 7% to 8% against PropNex's 5.2%. The per-share figure measures payout scale; the yield measures income return. Gross margins are within ten basis points of each other (10.3% versus 10.4%), so the operating-margin divergence comes entirely from overhead intensity, not from commission economics. The agent-count gap is the input; the net-margin gap is the output.
The five-year scoreboard
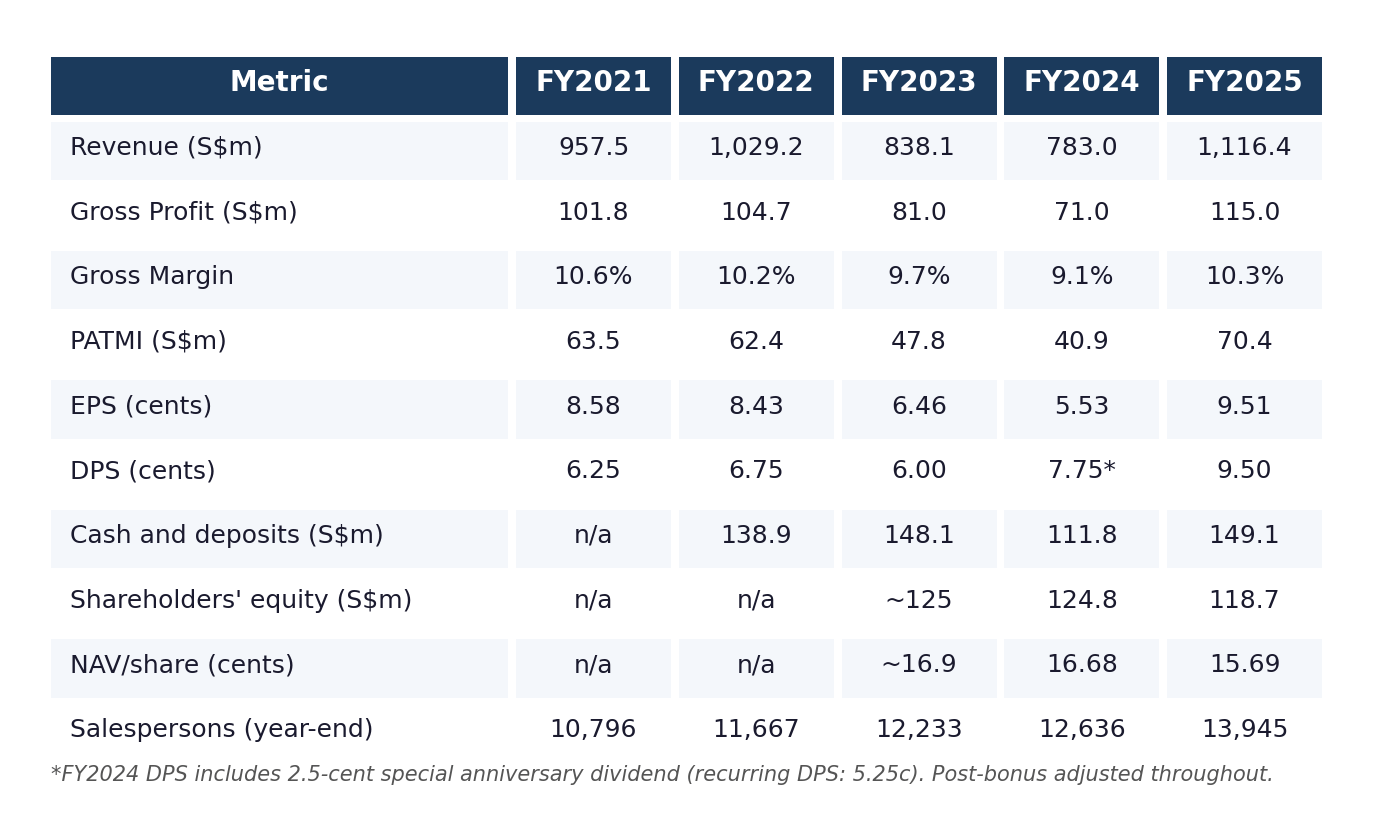
Three observations from the table. Gross margin moves within a narrow band of about 150 basis points across the full cycle, between 9.1% in FY2024 and 10.6% in FY2021, because costs scale with revenue when commissions are the dominant line. The company did not lose money even at the FY2024 trough; it earned S$40.9 million of PATMI on S$783 million of revenue.
Second, the dividend has been a constant signal. The payout ratio has been 80% or higher for at least four of the last five years. FY2024 paid more than earned (140% payout including the special anniversary dividend) and FY2025 paid 99.9% of earnings. The dividend has not been cut through the trough years. PropNex’s track record across the FY2023 to FY2024 trough was to draw on cash to honour the headline DPS rather than cut it.
Third, the salesforce has grown every year. From 10,796 at end-2021 to 13,945 at end-2025 is a 6.6% CAGR. The acceleration in 2025, from 12,636 to 13,945 or a 10.4% rise, is notable. The 1.6x gap over ERA has widened, not compressed.
Returns on equity are headline-extraordinary at approximately 58% for FY2025. Return on equity is the profit produced by every dollar of book equity the company holds. PropNex’s number is high not because margins are wide (net margin is 6.3%) but because the equity base is small; the company distributes almost every dollar it earns as dividend, so nothing accumulates. This is the precise economic characteristic of an asset-light intermediary at scale: you can add a thousand agents next year without funding new capital.
One quiet structural tailwind worth noting before the cycle discussion. PropNex earns a percentage of transaction value across every segment. When Singapore property prices rise — and the Urban Redevelopment Authority’s Private Property Price Index has risen roughly 38% over the six years to end-2025, with the HDB Resale Price Index up a similar magnitude [4][5] — the absolute commission per transaction rises proportionally, even if volumes are flat. The franchise compounds even in flat-volume years.
The mispricing: where the market may be too bearish
This is the heart of the investment case. The market is pricing PropNex on the assumption that FY2026 earnings collapse the way FY2023 did, when project marketing led the cycle down. Run the numbers segment by segment and that assumption does not hold up, for three structural reasons.
First, the 4Q25 backlog. Singapore’s revenue recognition convention runs three to four months behind the option-to-purchase exercise. A meaningful share of the strong October to December 2025 launch sales lands in 1H26 results regardless of what FY2026 launch volumes do. The first half of 2026 is, in revenue terms, already partly written.
Second, the segment mix. Project marketing is 39% of revenue. The other 61% — private resale, rental, HDB resale, landed, commercial — is driven by volumes that management guides as flat to growing, not falling. A 17% decline in one segment that is 39% of the business is not a 17% decline in the business.
Third, the MOP wave. This is the structural event the market is under-weighting. The 13,500 HDB flats reaching their five-year minimum occupation period in 2026 are a mechanical supply event, 69% larger than the 2025 cohort. Not every MOP-eligible flat goes to market — the Ministry of National Development has published year-by-year cohort conversion data showing what share of each cohort actually transacts [10][11] — but a meaningful share does, and each one tends to generate a chain of commissions for PropNex across the HDB seller-side and the follow-on private purchase.
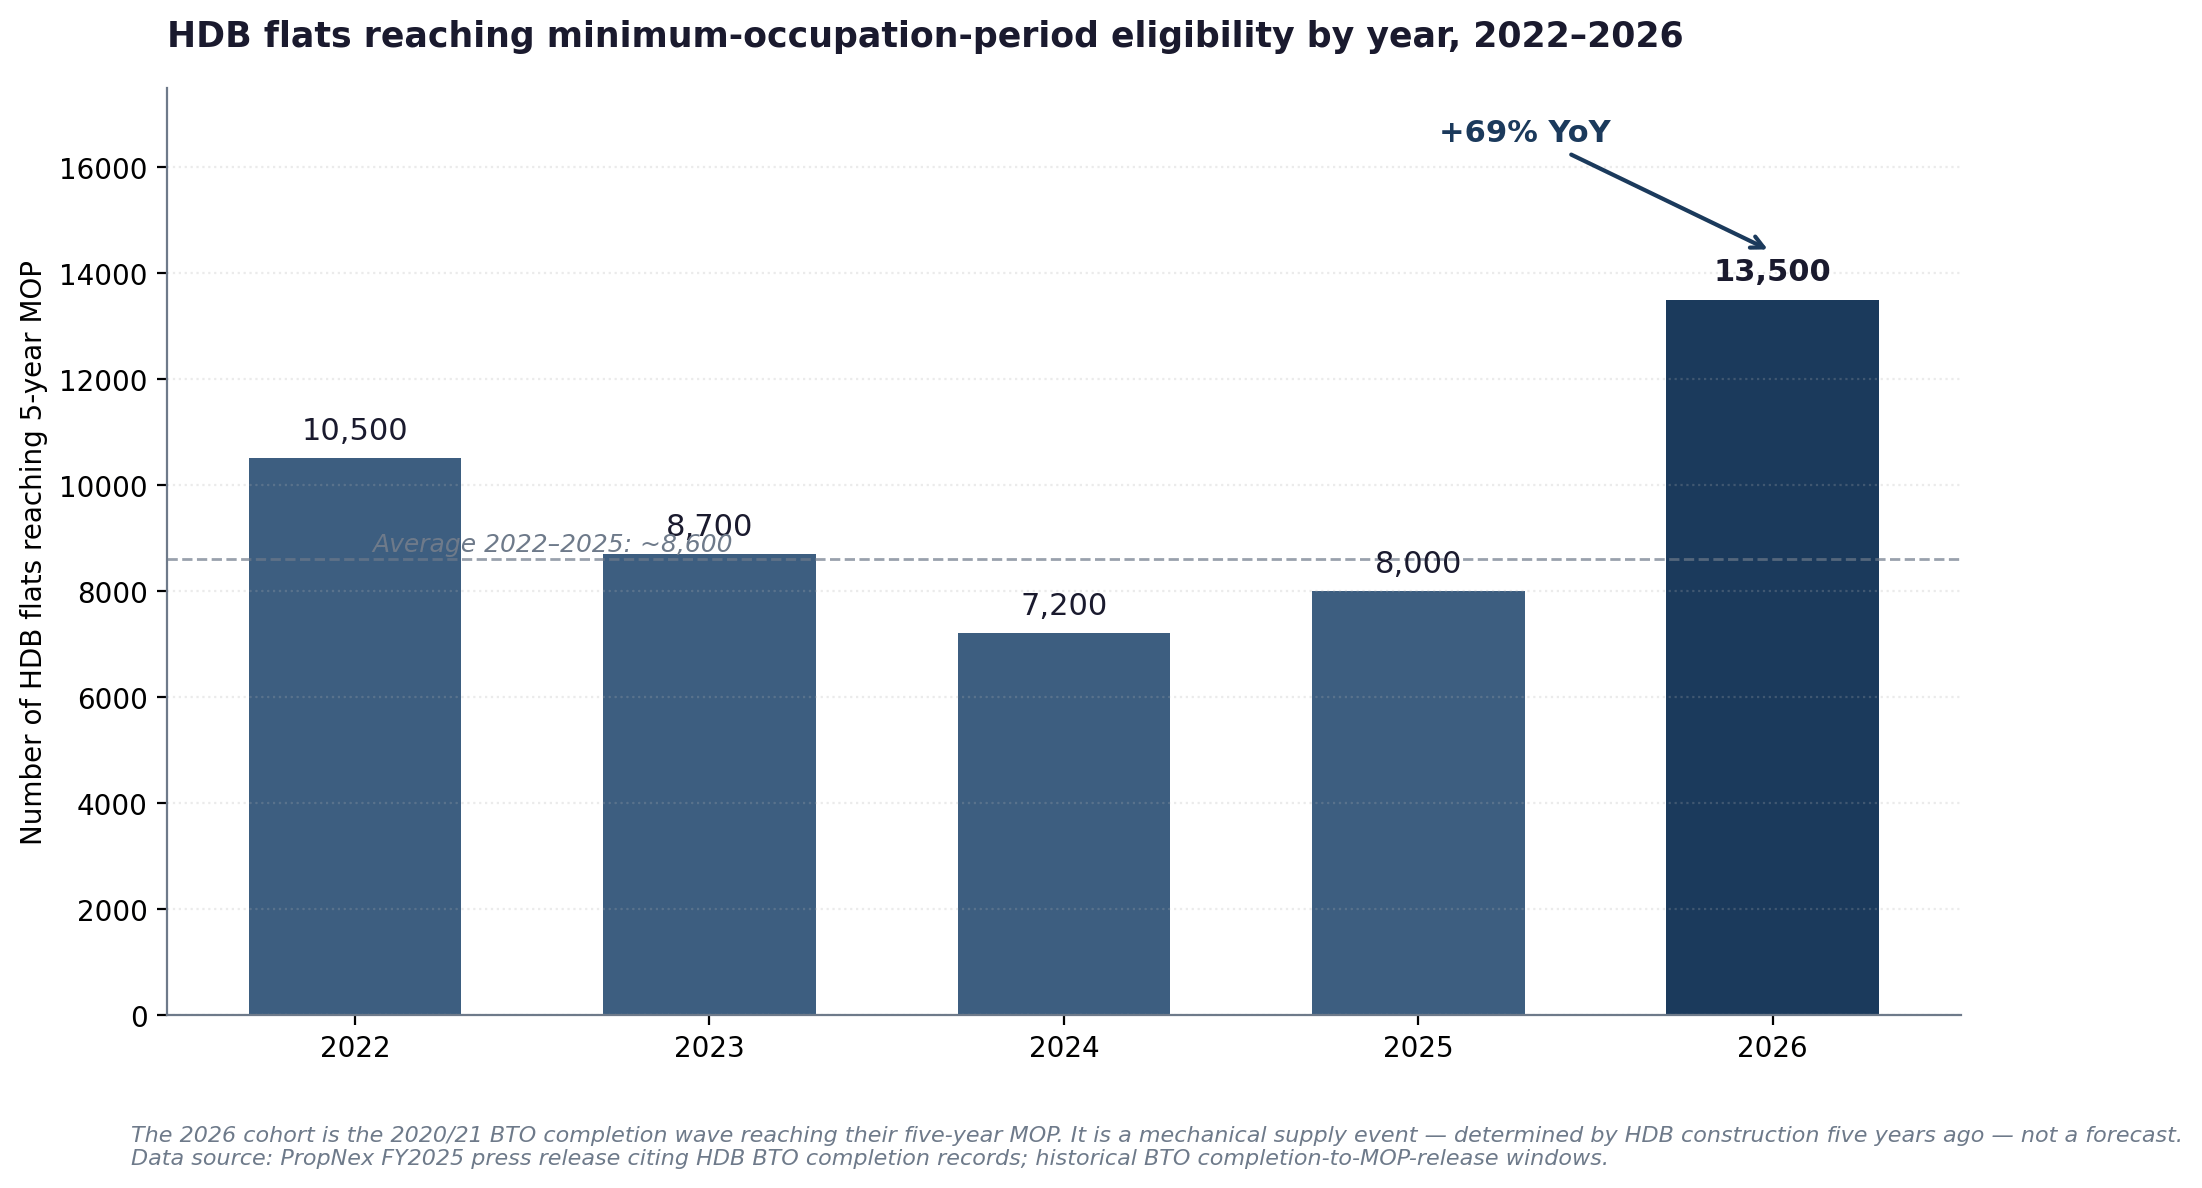
One clarification, because it matters: the 13,500 figure is the standard 5-year MOP cohort. The newer 10-year MOP regime, covering Prime Location Public Housing (introduced November 2021) and the Plus and Prime tiers (introduced under the August 2024 BTO framework reform), has not yet reached MOP and will not start clearing that gate until the mid-2030s [12]. The 2026 cohort is entirely standard 5-year MOP flats.
We ran the segment-level arithmetic through every revenue line: project marketing net of the 4Q25 backlog, the MOP wave modelled across three conversion-rate scenarios anchored to the MND’s published cohort data, and the resale, rental, landed and commercial segments built up individually. The result is a FY2026 earnings range that is materially higher than what the current share price implies. The gap between the two — between what the market is pricing and what the segment build produces — is where the value sits.
The full segment-by-segment build, every revenue line modelled, the MOP conversion scenarios laid out in a sensitivity table, the FY2026 revenue bridge, and the resulting PATMI range set against the market-implied number, is not laid out in this article. The full build is here.
What you pay at S$1.83
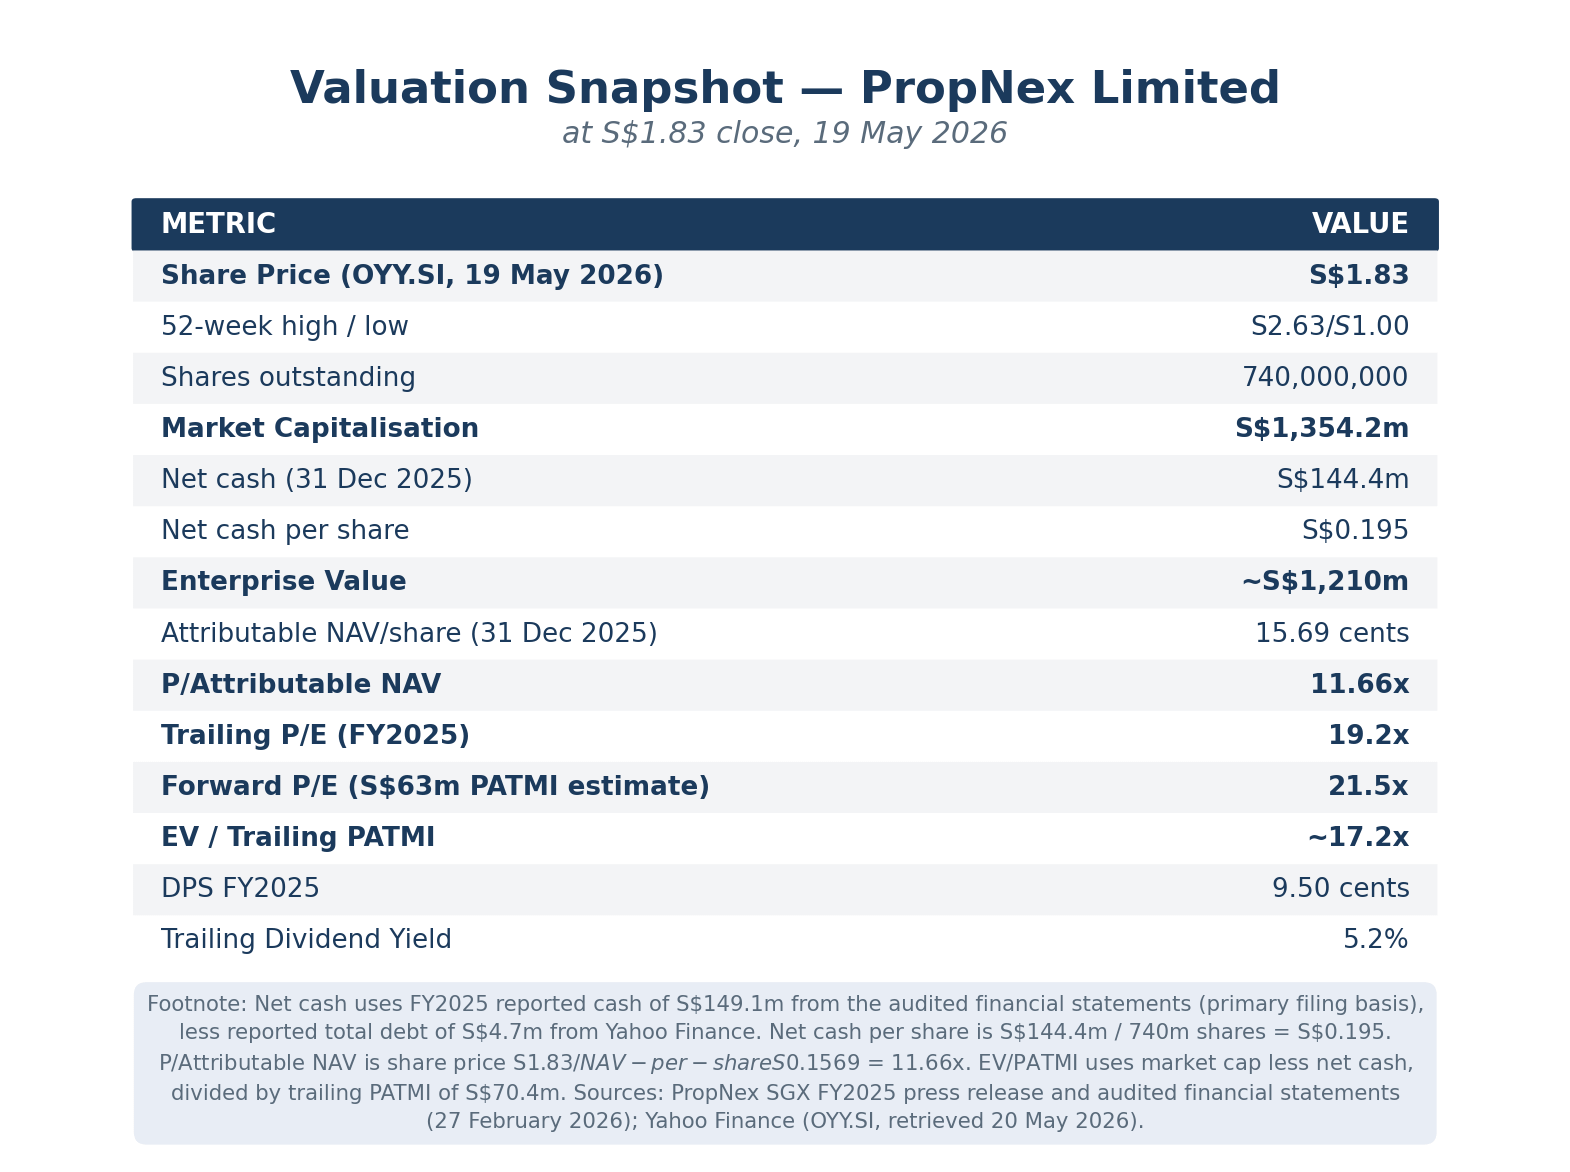
Two things in this table are worth unpacking for what they tell you about the downside.
P/Attributable NAV of 11.66x looks expensive, and it is the wrong multiple. P/Attributable NAV is the share price divided by the company’s book value per share. Book value is what is left over on the balance sheet after twenty-five years of distributing most earnings as dividends. For an asset-light intermediary like PropNex, the book value is a residual accounting number, not the economic value of the franchise. The salesforce of 14,333 agents, the project marketing relationships, the brand, the training infrastructure: none of these sit on the balance sheet. Comparing PropNex’s 11.66x P/NAV to a property developer’s P/NAV of around 1x is a category error. The right multiple for an intermediary is earnings-based.
Enterprise value over trailing PATMI is 17.2x, meaningfully lower than the 19.2x trailing P/E. The simple reason for the gap: PropNex sits on S$144 million of net cash, equivalent to S$0.20 per share or roughly 10% of the market capitalisation. When you back that cash out (which is what an acquirer would do), the multiple you are paying for the actual operating business drops from 19.2x to 17.2x. That cash is the margin of safety: it is idle on the balance sheet, available to fund the dividend through any cyclical trough, and not currently being used to generate earnings, so it represents real per-share value that the trailing P/E understates. The share price, market capitalisation, and the multiples derived from them are as at the 20 May 2026 close [3]; net cash, NAV, and DPS are from PropNex’s FY2025 audited results.
The yield, at least, is unambiguous. At the S$1.83 close [3] and an FY2025 DPS of 9.5 cents, the trailing yield is 5.2%. PropNex’s track record across the FY2023 to FY2024 trough was to pay out 92.9% then 140% of earnings, drawing on cash to honour the headline DPS. A scenario in which PropNex actually cuts the dividend would require a multi-year sustained earnings decline of 35% or more, which would also imply a broader Singapore residential market collapse that has not occurred in the recent two decades. The yield, in other words, is durable.
The risk that matters
Every investment case has a central risk, and PropNex’s is specific: a government cooling measure that targets the HDB resale-to-private upgrader chain.
Singapore’s government has actively managed the residential property cycle since the 1990s. The toolkit includes additional buyer’s stamp duty (ABSD), seller’s stamp duty, loan-to-value limits, and minimum occupation periods. The April 2023 ABSD package — which raised the rate on Singapore citizens’ second-property purchases from 17% to 20% and the foreigner rate from 30% to 60% — drove the FY2023 to FY2024 transaction trough that PropNex’s earnings reflect [14][15]. The MOP wave thesis turns on owners’ ability to sell their MOP-eligible flats and buy private property. A new measure that attacks that chain (a further ABSD increase on citizens’ second properties, or an extension of the HDB MOP period) would compress the thesis directly.
There is a reassuring data point here. In early May 2026, the government did act on the property market, but on executive condominiums specifically, doubling the EC minimum occupation period from five to ten years and scrapping the deferred payment scheme [8][9]. This package targets ECs, not HDB. The 13,500 HDB flats reaching MOP in 2026 are unaffected. More importantly, it signals that the government’s current preference is for surgical, single-segment intervention rather than blanket cooling, which is a positive signal for PropNex’s broader resale lines. It is not, however, an all-clear: the government has demonstrated it is in active intervention mode, and a follow-on HDB-targeted measure cannot be ruled out.
The bottom line
PropNex at S$1.83 is a high-quality Singapore residential agency franchise that the market has marked down on a peak-cycle read. The franchise case is not in dispute: a 14,333-agent salesforce that is 1.6 times its nearest competitor and still growing, 64% market share, asset-light economics that produce a ~58% return on equity, S$0.20 per share of net cash, and a dividend that has not been cut through the worst two years of the recent cycle. The competitive benchmarking against APAC Realty shows the scale advantage is real and compounding: same commission economics, double the net margin, roughly ten times the net cash.
The investment question is whether the market’s 30% drawdown correctly prices FY2026. The market is anchored on the 17% guided drop in new private home launches. The segment-level work (the 4Q25 recognition backlog, the segment mix where 61% of revenue is not new launches, and the 13,500-flat MOP wave) suggests the market may be pricing in a steeper decline than the franchise’s actual revenue structure warrants. The gap between the market-implied earnings and the segment-built earnings is the opportunity, if it is real.
This article has made the franchise case in full. What it leaves for the longer analysis is the quantification — the precise FY2026 earnings range, the forward valuation, the scenario-weighted price levels, and the complete four-trigger risk register — drawn from the same research base and the same figures, fully built out.
If the franchise case above has convinced you that PropNex is worth understanding properly, the institutional-length version is where the analysis is finished.
Data integrity notes
Correction (21 May 2026): An earlier version framed PropNex's higher per-share dividend (9.50 cents vs APAC Realty's 4.50 cents) as the number that matters "for a yield-oriented investor." That was misleading. Because APAC Realty trades at roughly a third of PropNex's share price, APAC Realty carries the higher dividend yield — about 7% to 8% on its FY2025 dividend, against PropNex's 5.2%. The dividend figures themselves were correct; the per-share gap measures payout scale, not income return. With thanks to the reader who flagged it.
All financial figures in this article are from PropNex’s SGX-filed press releases and audited financial statements FY2021 to FY2025 [1][2]. Industry agent counts are from the Council for Estate Agencies registry as cited in PropNex’s FY2025 business slides [6]. Market share figures are Frost & Sullivan FY2023 (the most recent comprehensive published baseline) [7] cross-referenced against PropNex’s own market-share disclosures in business slides. FY2026 guidance is PropNex’s own management guidance from the 27 February 2026 press release [1]. Share price and market data are from Yahoo Finance, retrieved 20 May 2026 [3]. APAC Realty comparison figures are from APAC Realty’s SGX-filed Condensed Interim Financial Statements 2H/FY2025 [13].
The MOP wave conversion analysis referenced in this article is anchored to the Ministry of National Development’s published parliamentary written answer covering HDB cohort conversion data for 2011 through 2020 [10][11]. The agent-mediated share estimates (85–95%) are our analytical inferences, not published statistics; Singapore does not publish a clean for-sale-by-owner share figure. Research notes from brokerage firms covering PropNex were read during the research process for context but are not cited in this article.
References
[1] PropNex Limited, “FY2025 Full Year Results Announcement”, SGX press release, 27 February 2026.
[2] PropNex Limited, “FY2025 Business Update Slides”, SGX filing, 27 February 2026.
[3] PropNex Limited (OYY.SI), share price and market data via Yahoo Finance, retrieved 20 May 2026. https://finance.yahoo.com/quote/OYY.SI/
[4] Urban Redevelopment Authority of Singapore, “Private Residential Property Price Index, 4Q2025”, quarterly release, January 2026. https://www.ura.gov.sg/Corporate/Media-Room/Media-Releases
[5] Housing Development Board, “HDB Resale Price Index, 1Q2026”, quarterly release, April 2026. https://www.hdb.gov.sg/about-us/news-and-publications/press-releases
[6] Council for Estate Agencies, “Registered Salespersons Statistics”, as at 20 February 2026. https://www.cea.gov.sg/aceas/public/svc101/
[7] Frost & Sullivan, “Singapore Real Estate Agency Industry Report — FY2023 Market Share Analysis”, commissioned by PropNex, 2024.
[8] Ministry of National Development of Singapore, statement on executive condominium scheme revisions (MOP extension from five to ten years, deferred-payment-scheme withdrawal, first-timer quota raised to 90%), early May 2026. https://www.mnd.gov.sg/newsroom
[9] Chong, Xin Wei, “New EC rules to cool prices: MOP doubled to curb flipping, no more deferred payments, and more units for first-timers”, The Business Times, May 2026. https://www.businesstimes.com.sg/property/new-ec-rules-cool-prices-mop-doubled-curb-flipping-no-more-deferred-payments-and-more-units-first
[10] Ministry of National Development of Singapore, “Written Answer on data on number of HDB flats eligible for resale and sold within one year, five years and ten years after five-year Minimum Occupation Period”, Parliamentary Q&A. https://www.mnd.gov.sg/newsroom/parliament-matters/q-as
[11] Ong, Ryan J., “13.4% Of BTO Flats Were Sold Within A Year Of MOP: What Does It Mean For Homebuyers?”, Stacked Homes, 22 September 2021. https://stackedhomes.com/editorial/13-4-of-bto-flats-were-sold-within-a-year-of-mop/
[12] Housing & Development Board, “Eligibility for Selling a Flat” — official policy page describing the MOP framework (5-year MOP for standard BTO flats; 10-year MOP for Prime Location Public Housing, Plus and Prime tiers). https://www.hdb.gov.sg/managing-my-home/selling-a-flat/eligibility
[13] APAC Realty Limited (SGX:CLN), “Condensed Interim Financial Statements for the six months and full year ended 31 December 2025”, SGX filing, February 2026 (FileID 875635). https://www.sgx.com/securities/company-announcements?value=APAC%20REALTY%20LIMITED&type=company
[14] Inland Revenue Authority of Singapore (IRAS), “Additional Buyer’s Stamp Duty (ABSD)” — historical rates schedule. https://www.iras.gov.sg/taxes/stamp-duty/for-property/buying-or-acquiring-property/additional-buyer’s-stamp-duty-(absd)
[15] Urban Redevelopment Authority of Singapore, quarterly residential transaction statistics — used to triangulate the historical transaction-volume response to ABSD tightening packages. https://www.ura.gov.sg/Corporate/Media-Room/Media-Releases
[16] Ho, Jovi, “ERA Singapore’s new initiative could double its salesforce this year”, The Edge Singapore, 24 March 2026. Source for the ERA +1 initiative announcement, Rayne Chua defection, and ERA salesforce counts. https://www.theedgesingapore.com/cityandcountry/property/era-singapores-new-initiative-could-double-its-salesforce-year
[17] PropNex Limited, “37 PropertyLimBrothers Salespersons, Including Co-Founder Adrian Lim, join PropNex”, press release, 13 May 2026. Source for the Adrian Lim/PLB return and the 14,333 CEA-registered salesforce figure as at 12 May 2026. https://www.propnex.com/news-details/12481/37-propertylimbrothers-salespersons-including-co-founder-adrian-lim-join-propnex
IMPORTANT DISCLAIMERS
This article is published for informational and educational purposes only. It does not constitute financial or investment advice, a recommendation, or a solicitation to buy, sell, or hold any securities. The author is not a licensed financial adviser under the Financial Advisers Act 2001 of Singapore. This content is exempt from the requirements of the Singapore Financial Advisers Act pursuant to Regulation 34 of the Financial Advisers Regulations, as it is published in a generally available publication. This publication does not take into account the specific investment objectives, financial situation, or particular needs of any individual. Before making any investment decision, readers should consult a licensed financial or investment adviser in their relevant jurisdiction. Past performance is not indicative of future results.
No Warranty: While the data and analysis have been prepared in good faith from public sources believed to be reliable, no representation or warranty, express or implied, is made as to the accuracy, completeness, or timeliness of the information. The author accepts no liability for any loss arising from the use of this material.
Disclosure: The author may or may not hold positions in the securities discussed. No compensation has been received from any company mentioned in this article.
The SEA Analyst, thanks for your analysis on PropNex Limited (OYY; PROP SP)
"The dividend gap is the headline number for a yield-oriented investor: 9.50 cents at PropNex against 4.50 cents at APAC Realty, a 2.11× per-share gap."
Would it be more accurate to compare dividend yield?
I believe dividend per share (DPS) may not be a fair comparison.
DPS is influenced by the number of shares outstanding, which has little to do with business performance.