

In the first half of 2026, two factories in Tainan and Ningbo turned out 2,171 billion tiny balls of metal. These solder spheres carry signals and power between chip packages and the boards they sit on. Their maker, Mi Material Holding, comes to the Singapore market on 28 October at S$1.80 a share, valuing the business at S$891.0 million.
On the numbers it chose to lead with, the price looks reasonable. Revenue in the six months to June 2026 was US$53.7 million, up 109.5% on the same half of 2025, and profit of US$14.3 million was larger than the whole of FY2025. Annualise that half and the offer price is 24.4 times earnings for a supplier whose end-customers the prospectus describes as among the world’s largest technology and chip companies.
The production line tells a different story from the revenue line. Spheres produced rose 22.0% over the same period. Revenue per sphere produced rose 72%. In the same months, the price of silver rose 140% and the price of tin 56%. Yet preliminary third-quarter figures in the prospectus show revenue rising again and gross margin holding near 48%, even as benchmark metal costs fell. The question is how much of the earnings improvement will last, and how much cash it will produce.
From a Tainan solder plant to a Singapore listing
The operating company is older than the listed one by 28 years. Accurus Scientific was incorporated in Tainan in 1998 to make ball-grid-array (BGA) solder spheres, solder bars, solder powder and copper wire for chip assembly. The Accurus brand survives on the product today. In 2006 Henkel’s electronics group bought the business, which gave it customers in the United States and Europe. Management bought it back in 2010. It developed proprietary alloys for wafer-level packaging and patented processes for making spheres.
A Singapore sales office followed in 2016 and a second factory, in Ningbo, in 2017, with commercial production there from 2021. That year Mi Technovation Berhad (MiTB), a Malaysian maker of semiconductor equipment listed on Bursa Malaysia, bought 99% of Accurus for RM271.01 million, paid entirely in new MiTB shares [3]. MiTB folded it in as its Semiconductor Material Business Unit. A Malaysian subsidiary, set up in 2024 to build a third plant in Senai, Johor, completes the group.
The Singapore holding company was incorporated on 28 April 2026. MiTB transferred the operating subsidiaries into it ahead of the listing.
At S$1.80 a share, the offer consists of 51.5 million new shares and 26.0 million existing shares sold by MiTB. A further 41.9 million new shares go to seven cornerstone investors: abrdn (Singapore and Malaysia), Amova Asset Management (formerly Nikko), Areca Capital, Barings, Fullerton and Manulife. MiTB will retain 73.7%, or 72.7% if the over-allotment option is exercised in full. Its Group CEO and controlling shareholder, Oh Kuang Eng, chairs Mi Material.
What a solder sphere does, and who pays for it
A modern chip package has hundreds to tens of thousands of electrical connections on its underside. Solder spheres form many of them. They are placed on the package substrate, melted and re-solidified to bond the package to a circuit board, or one layer of a package to another. Mi Material makes spheres from 0.030mm to 0.889mm in diameter. Smaller spheres fit more closely spaced connections, known as a finer pitch. They are also harder to make consistently. A single defective joint can scrap an expensive multi-chip AI package.
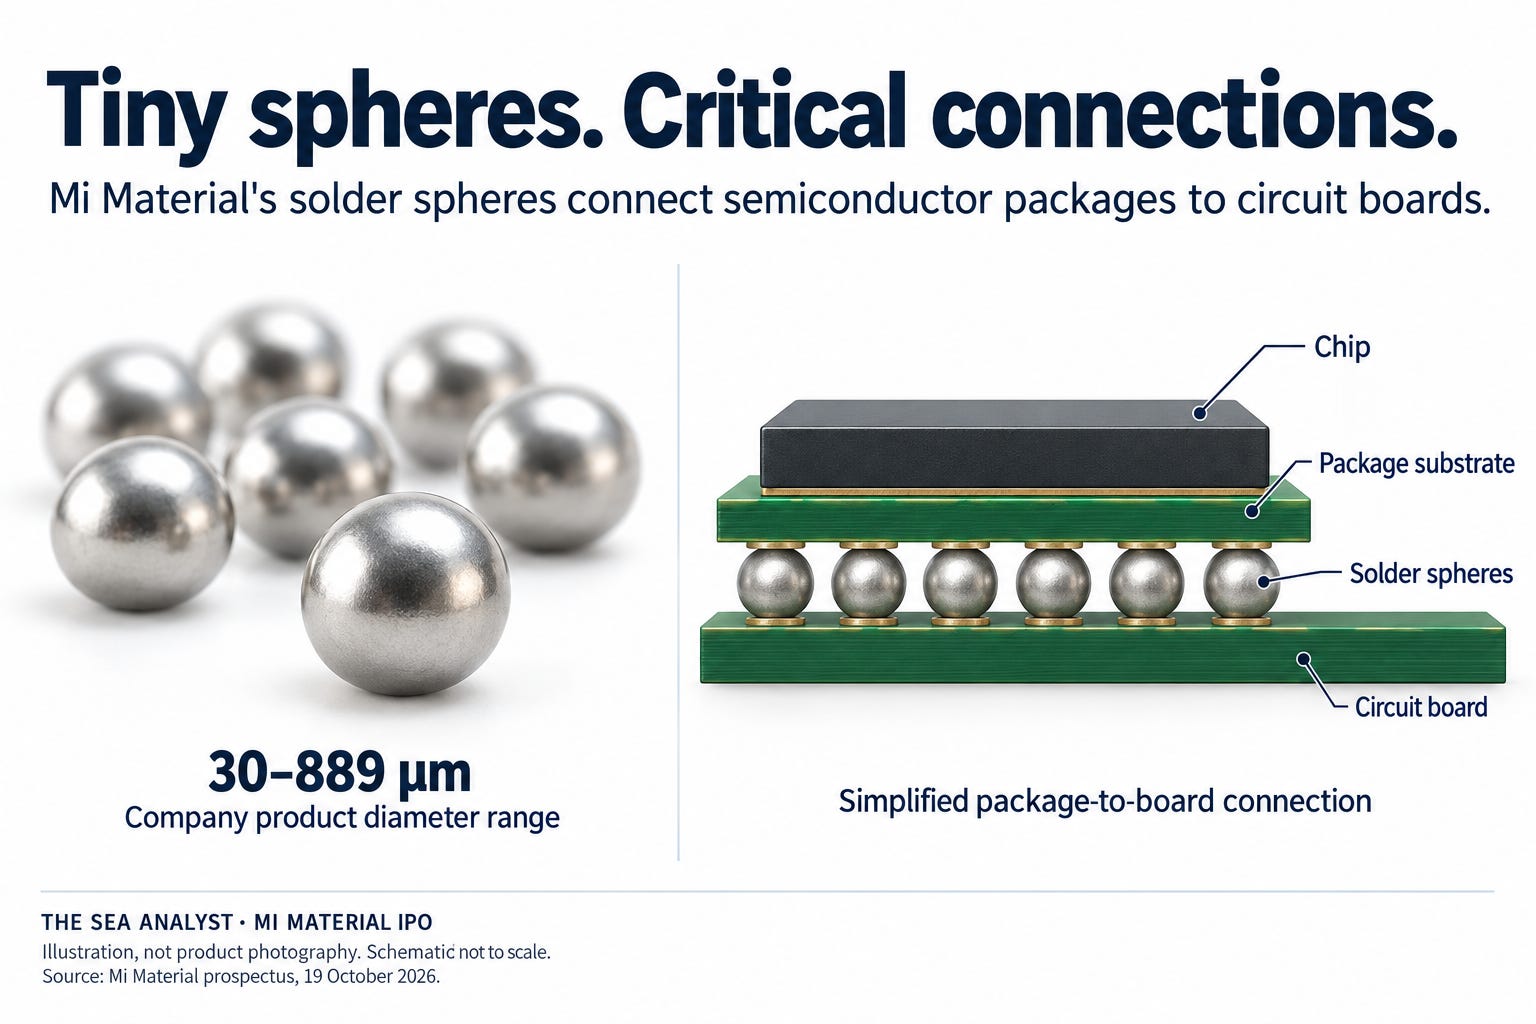
The company sells four product lines. Standard tin-silver-copper (SAC) alloys such as SAC305 (3.0% silver, 0.5% copper, the rest tin) are the commodity end. Cyclomax and iSAC are proprietary alloy families aimed at reliability under heat and current, and at fine pitch. A residual “others” line includes copper-core spheres, solder paste and a small chemicals distribution business in Singapore.
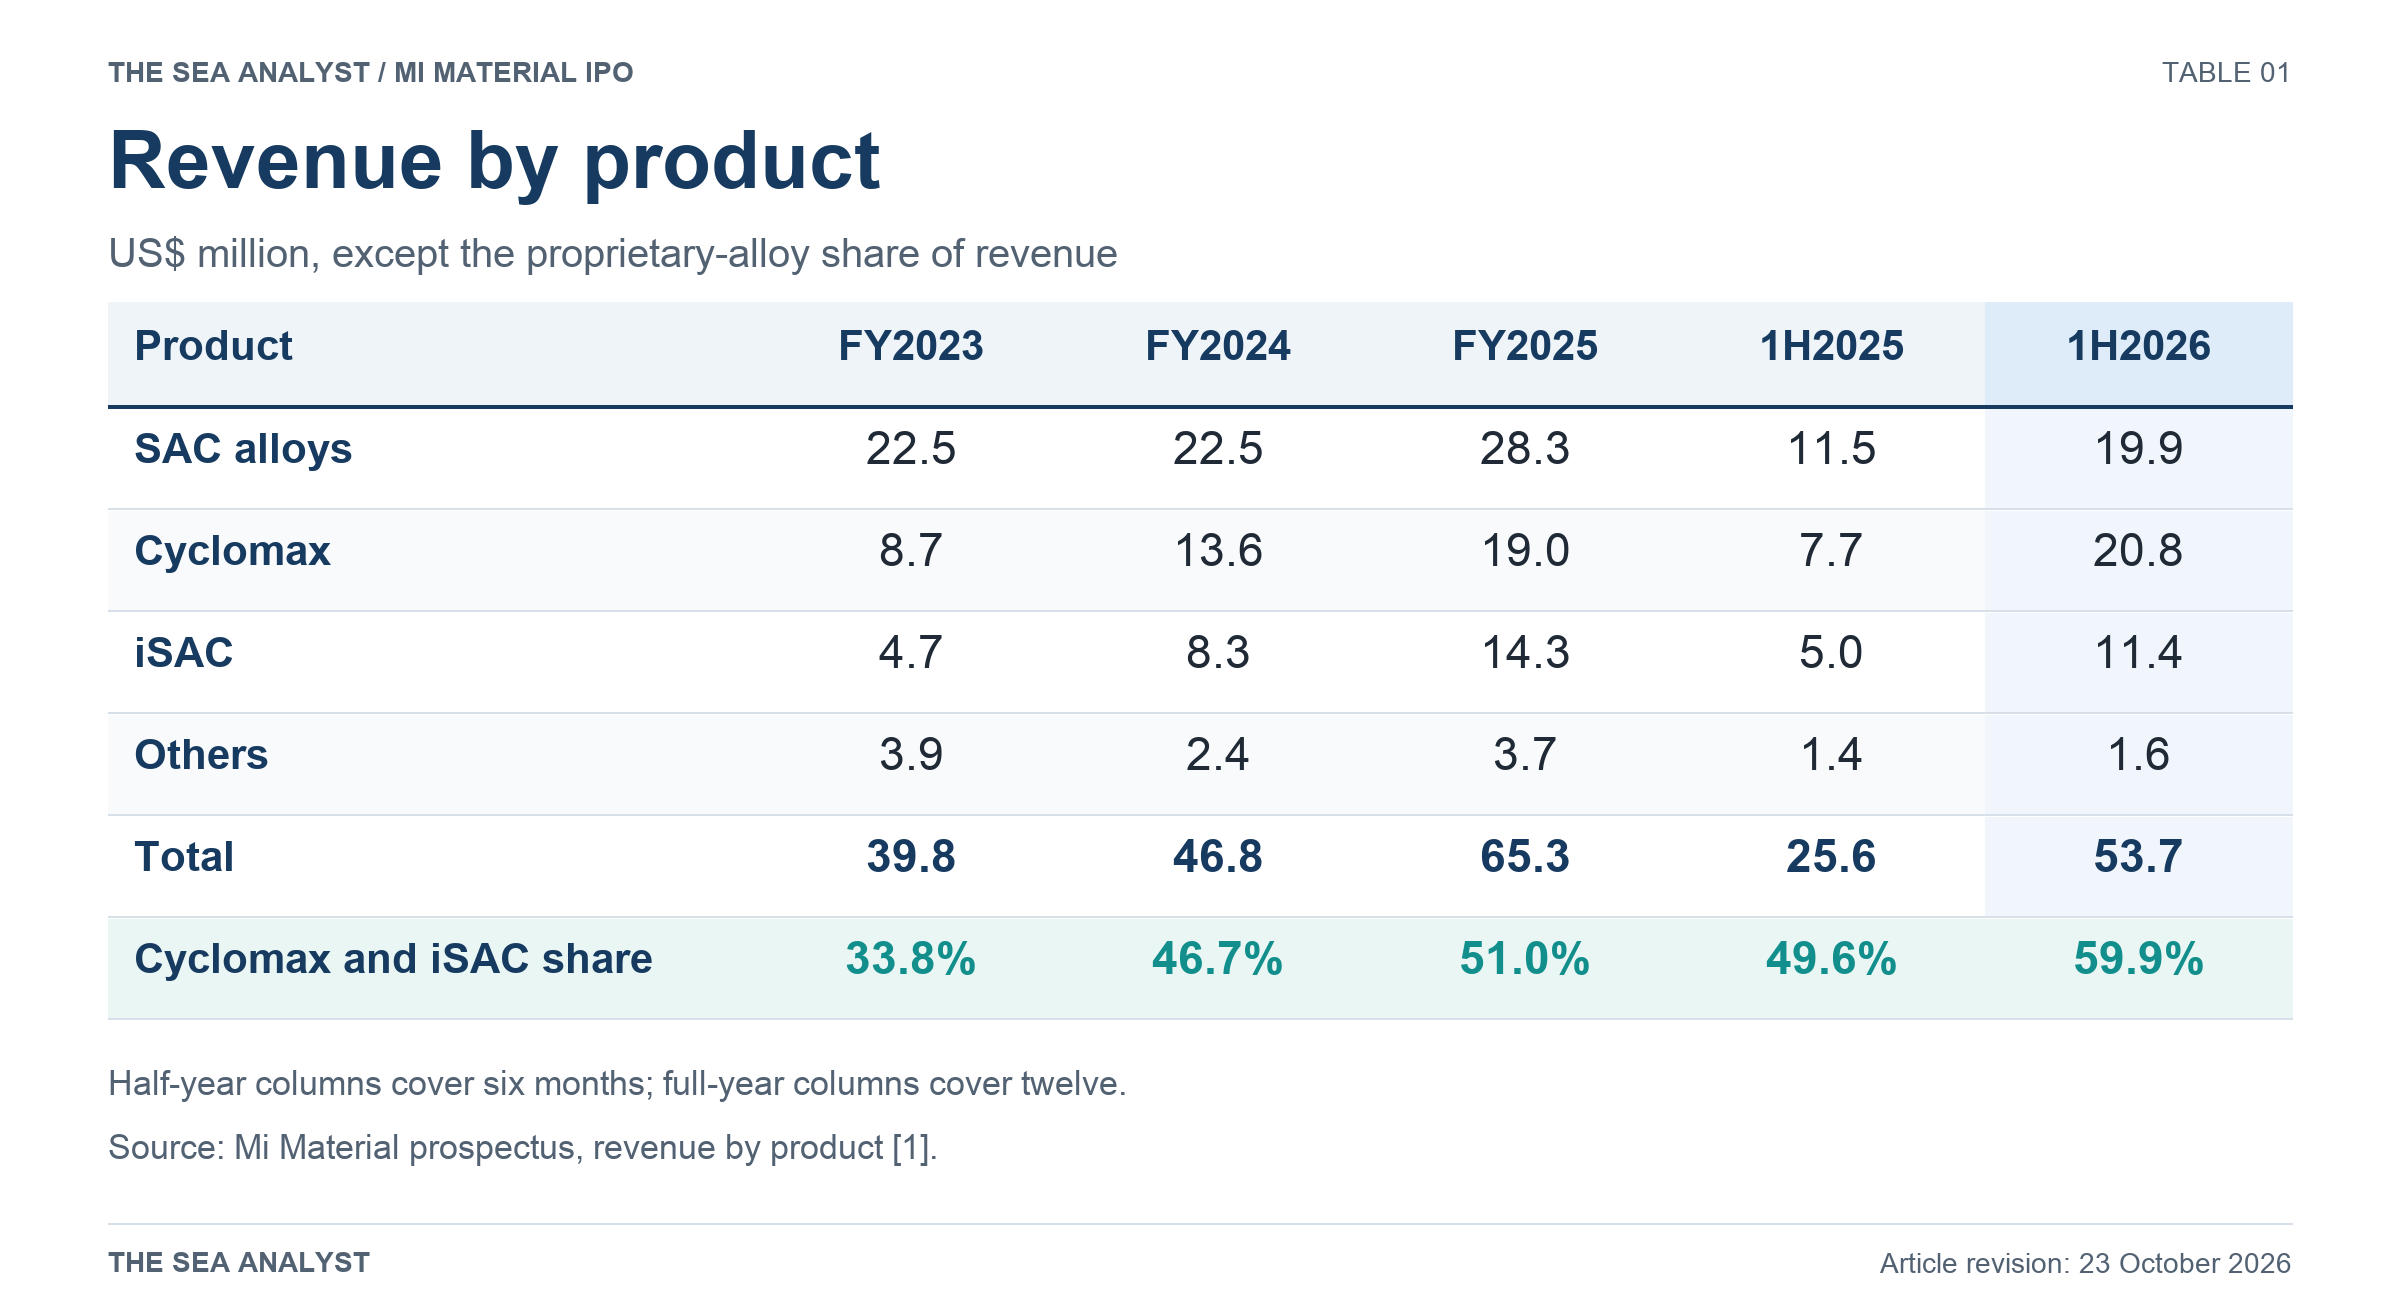
The two proprietary families grew from about 34% of revenue in FY2023 to 60% in 1H2026. This shift supports the company’s explanation for higher margins. It does not disclose units sold by product, so we cannot tell how much came from selling more proprietary spheres and how much from higher relative prices.
Mobility and wearables supplied 61.7% of revenue in 1H2026, HPC and memory 31.1%, and automotive and renewable energy 7.2% [1].
This is still predominantly a consumer-device supplier. High-performance computing (HPC) and memory serve AI as well as other computing applications; the company does not report AI or HBM sales separately. The whole 31.1% should not be read as AI revenue.
Mi Material has two types of customer.
Its direct customers, labelled A to I in the prospectus, place the orders and pay the bills. They include outsourced semiconductor assembly and test companies (OSATs), foundries that manufacture chips, and integrated device makers that design and manufacture their own chips. The top five direct customers supplied 41.4% of 1H2026 revenue; the two largest have bought from Mi Material for 16 and 22 years.
End-customers, labelled X, Y and Z, specify and qualify materials for the chips they design. That limits a manufacturer’s freedom to switch suppliers, but it does not remove its role in procurement. Price, delivery and factory requirements still matter, and Mi Material negotiates selling prices with customers. The roles can overlap: direct Customer C belongs to end-customer Z’s group and buys exclusively for Z [1].
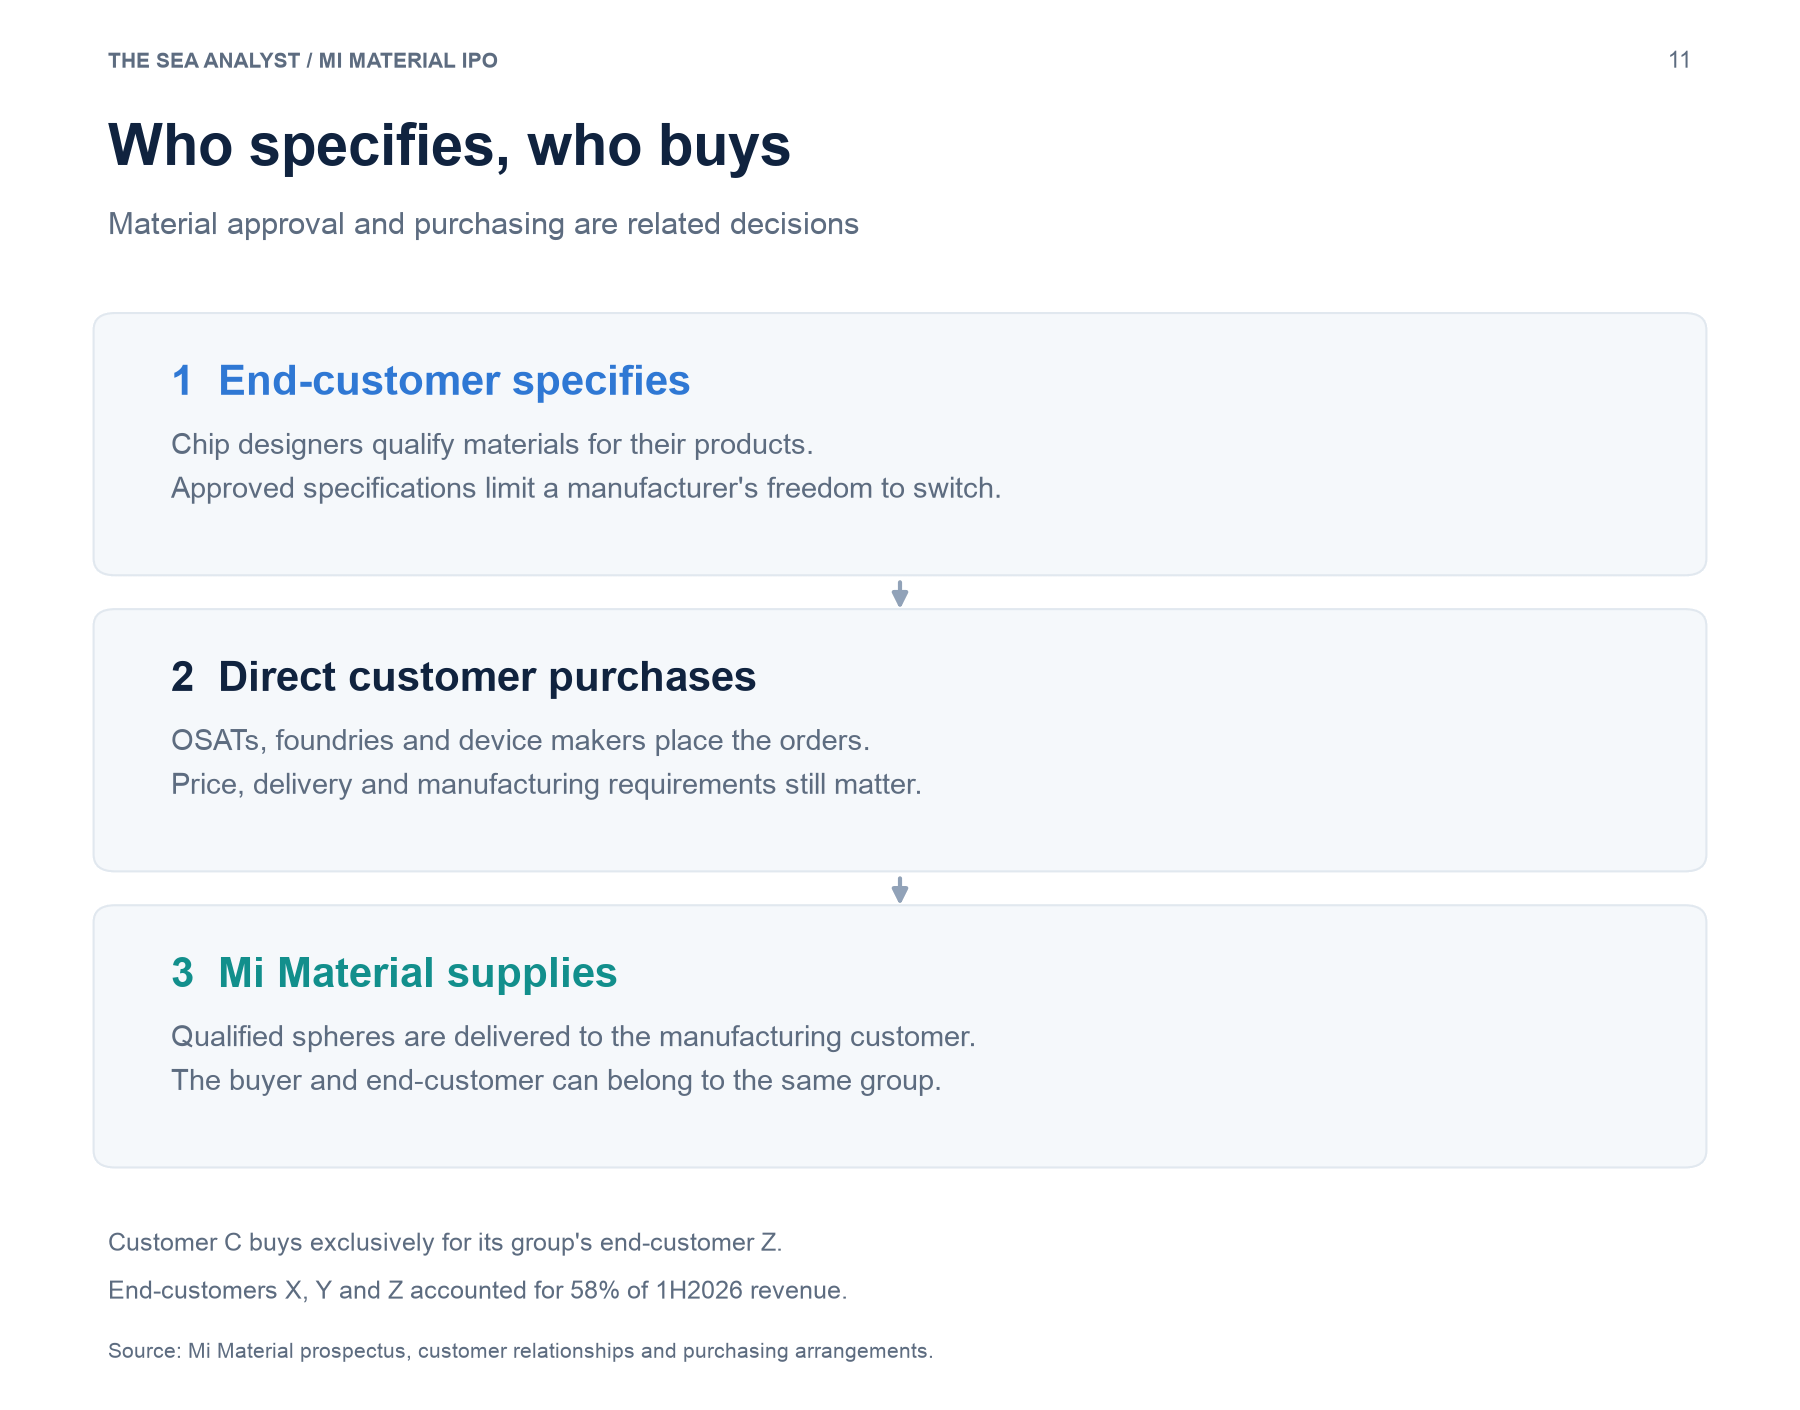
The prospectus leaves these end-customers unnamed, but their profiles strongly suggest Apple (Customer X), Broadcom (Customer Y) and Micron (Customer Z). These identifications are our inference, rather than company-confirmed names.
Customer X, a multinational technology company with premium consumer electronics, its own operating systems and a retail presence in more than 150 countries, accounted for 24% of revenue in 1H2026, up from 20% in FY2023.
Customer Y, one of the world’s largest chipmakers, whose devices include ASICs used in data centres, networking and AI products, accounted for 18%, up from 13%.
Customer Z, a US memory maker whose products include high-bandwidth memory (HBM), accounted for 16%, up from 10% in FY2025. Its rising share is the clearest sign in the filings that memory demand is becoming more important.
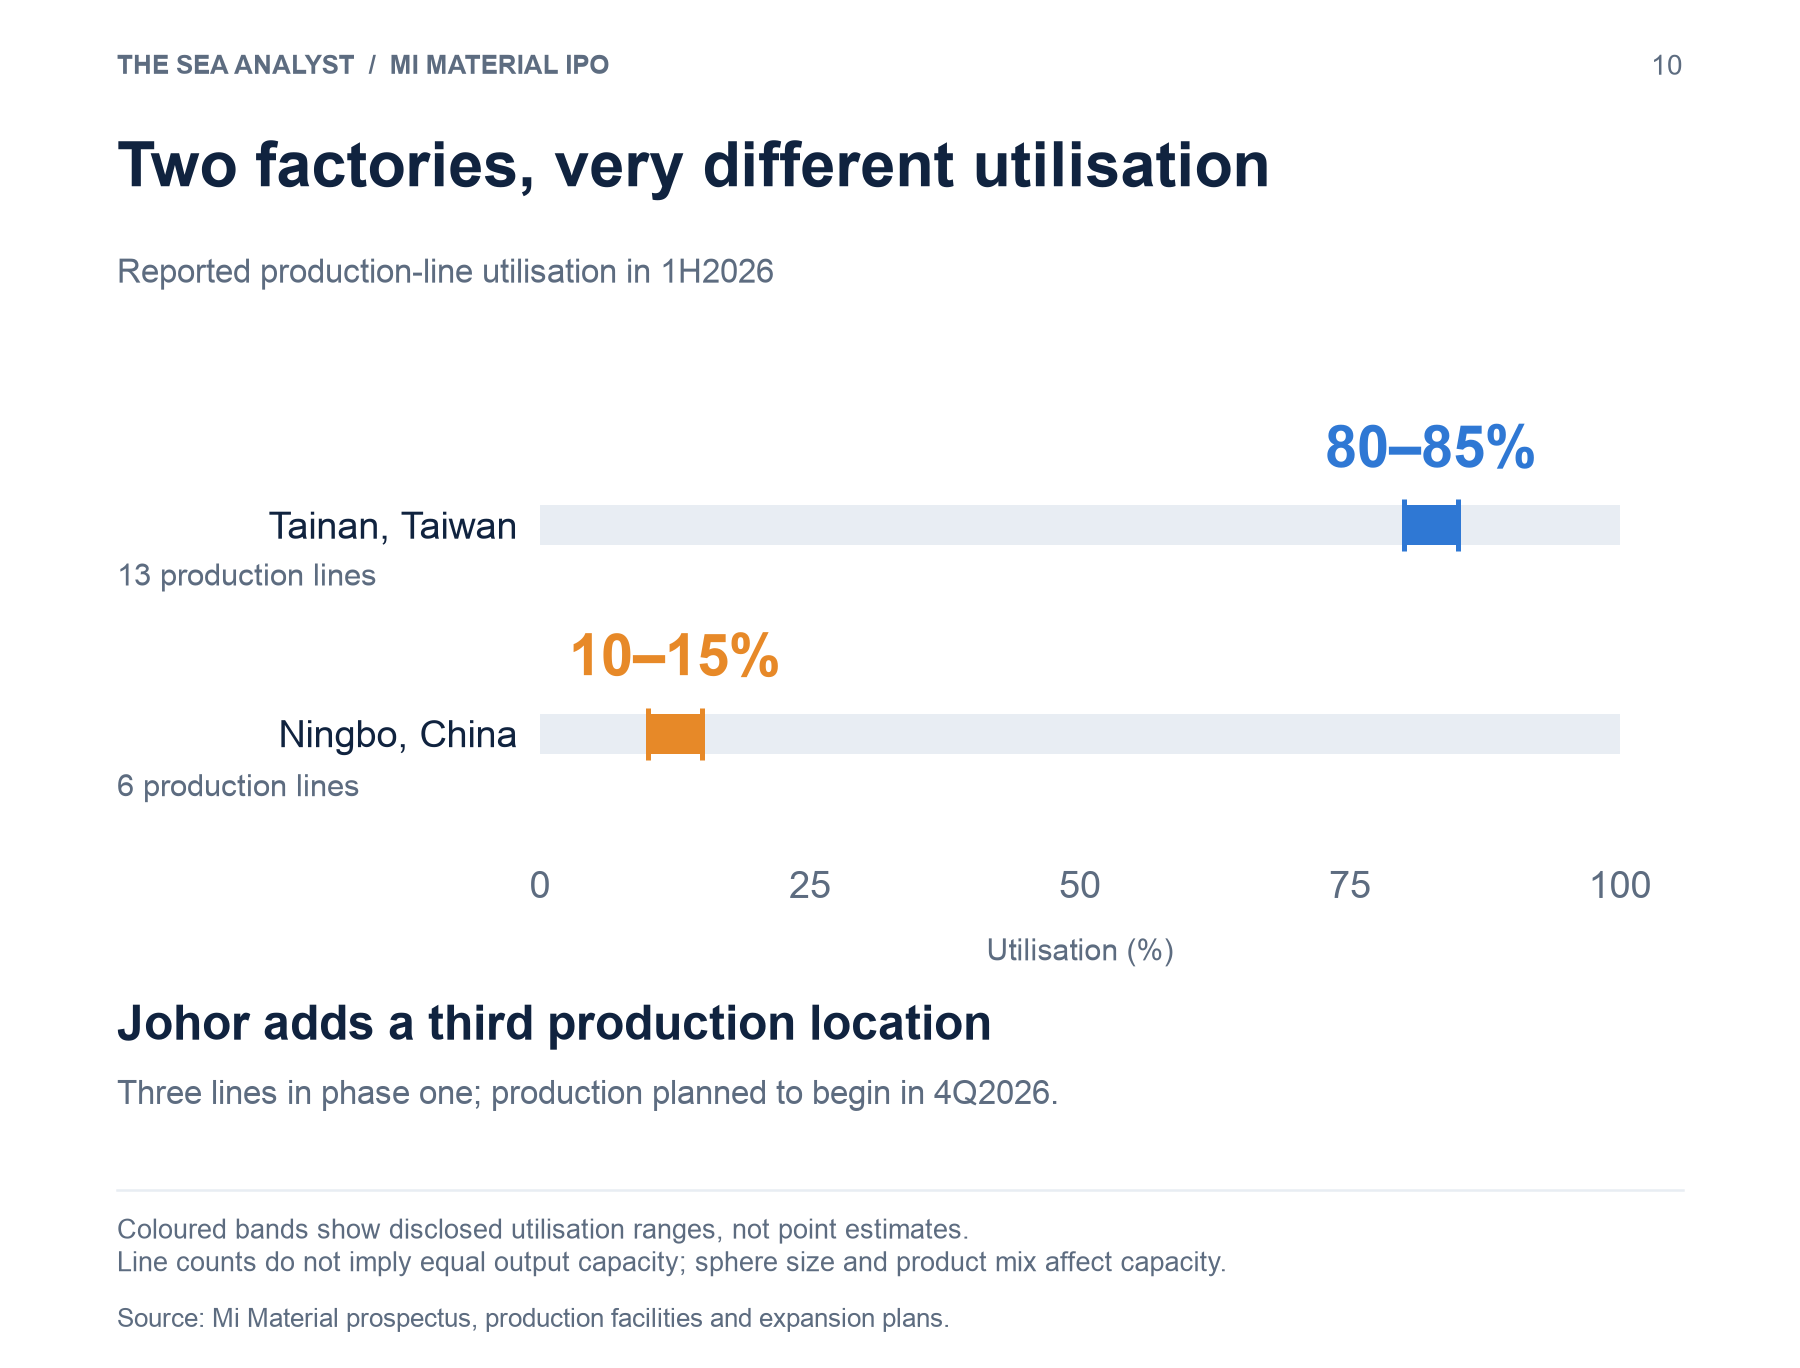
Those orders are served by 19 production lines: 13 in Tainan, running at 80% to 85% of capacity in 1H2026, and six in Ningbo, at 10% to 15%. Ningbo has made an operating loss since commercial production began.
Johor will add an alternative production site for regional customers currently supplied from Taiwan. Its first three lines are due to be ready in 4Q2026, with customer qualification and ramp-up following in 2027. Tainan is also due to add four lines, with work starting in 2027 and operations planned for 2030. Together, the projects would lift annual capacity from 6,600-8,900 billion spheres to 11,340-15,260 billion.
A small market growing fast
The industry consultant Yole, commissioned for the prospectus, sizes the global solder sphere market at about US$220 million in 2023 and the segment Mi Material actually serves, which excludes electroplated bumps and hybrid bonding, at about US$173 million [2]. Yole forecasts that serviceable market to reach nearly US$978 million by 2031, growth of about 23.5% a year from 2025 [2]. It estimates Mi Material’s 2025 share at 17% of the whole market and 24% of the serviceable segment, which it reads as a top-three position [2].
Yole expects computing to drive much of that growth. Across the broader market, which Yole expects to reach about US$1.9 billion in 2031, HPC and memory rise from US$55 million in 2023 to US$969 million in 2031. Their share of market value increases from 25% to 50%, while mobile and wearables fall from about 63% to 41% [2]. AI accelerators and HBM stacks use larger packages with more connections, and the finest-pitch spheres command the highest prices.
Yole’s forecasts measure industry revenue, not sphere volumes or Mi Material’s own sales mix. Higher metal prices lift the selling price of spheres and therefore the reported market size. Part of Yole’s 26.2% annual market growth for 2023 to 2025 reflects that effect [2].
Results from two major chipmakers point to strong demand in the markets Mi Material wants to serve. TSMC, a foundry that manufactures chips for designers, reported third-quarter US-dollar revenue up 41.2% year on year and guided to another increase in the fourth quarter [15]. Micron, an integrated device maker that designs and manufactures memory, reported record fiscal 2026 results and expects a stronger fiscal 2027 [16]. They offer a view of logic-chip and memory demand respectively; neither is identified here as a confirmed Mi Material customer. Their sales also reflect chip prices, so the growth cannot be translated directly into sphere orders.
What protects the margin, and where the protection is thin
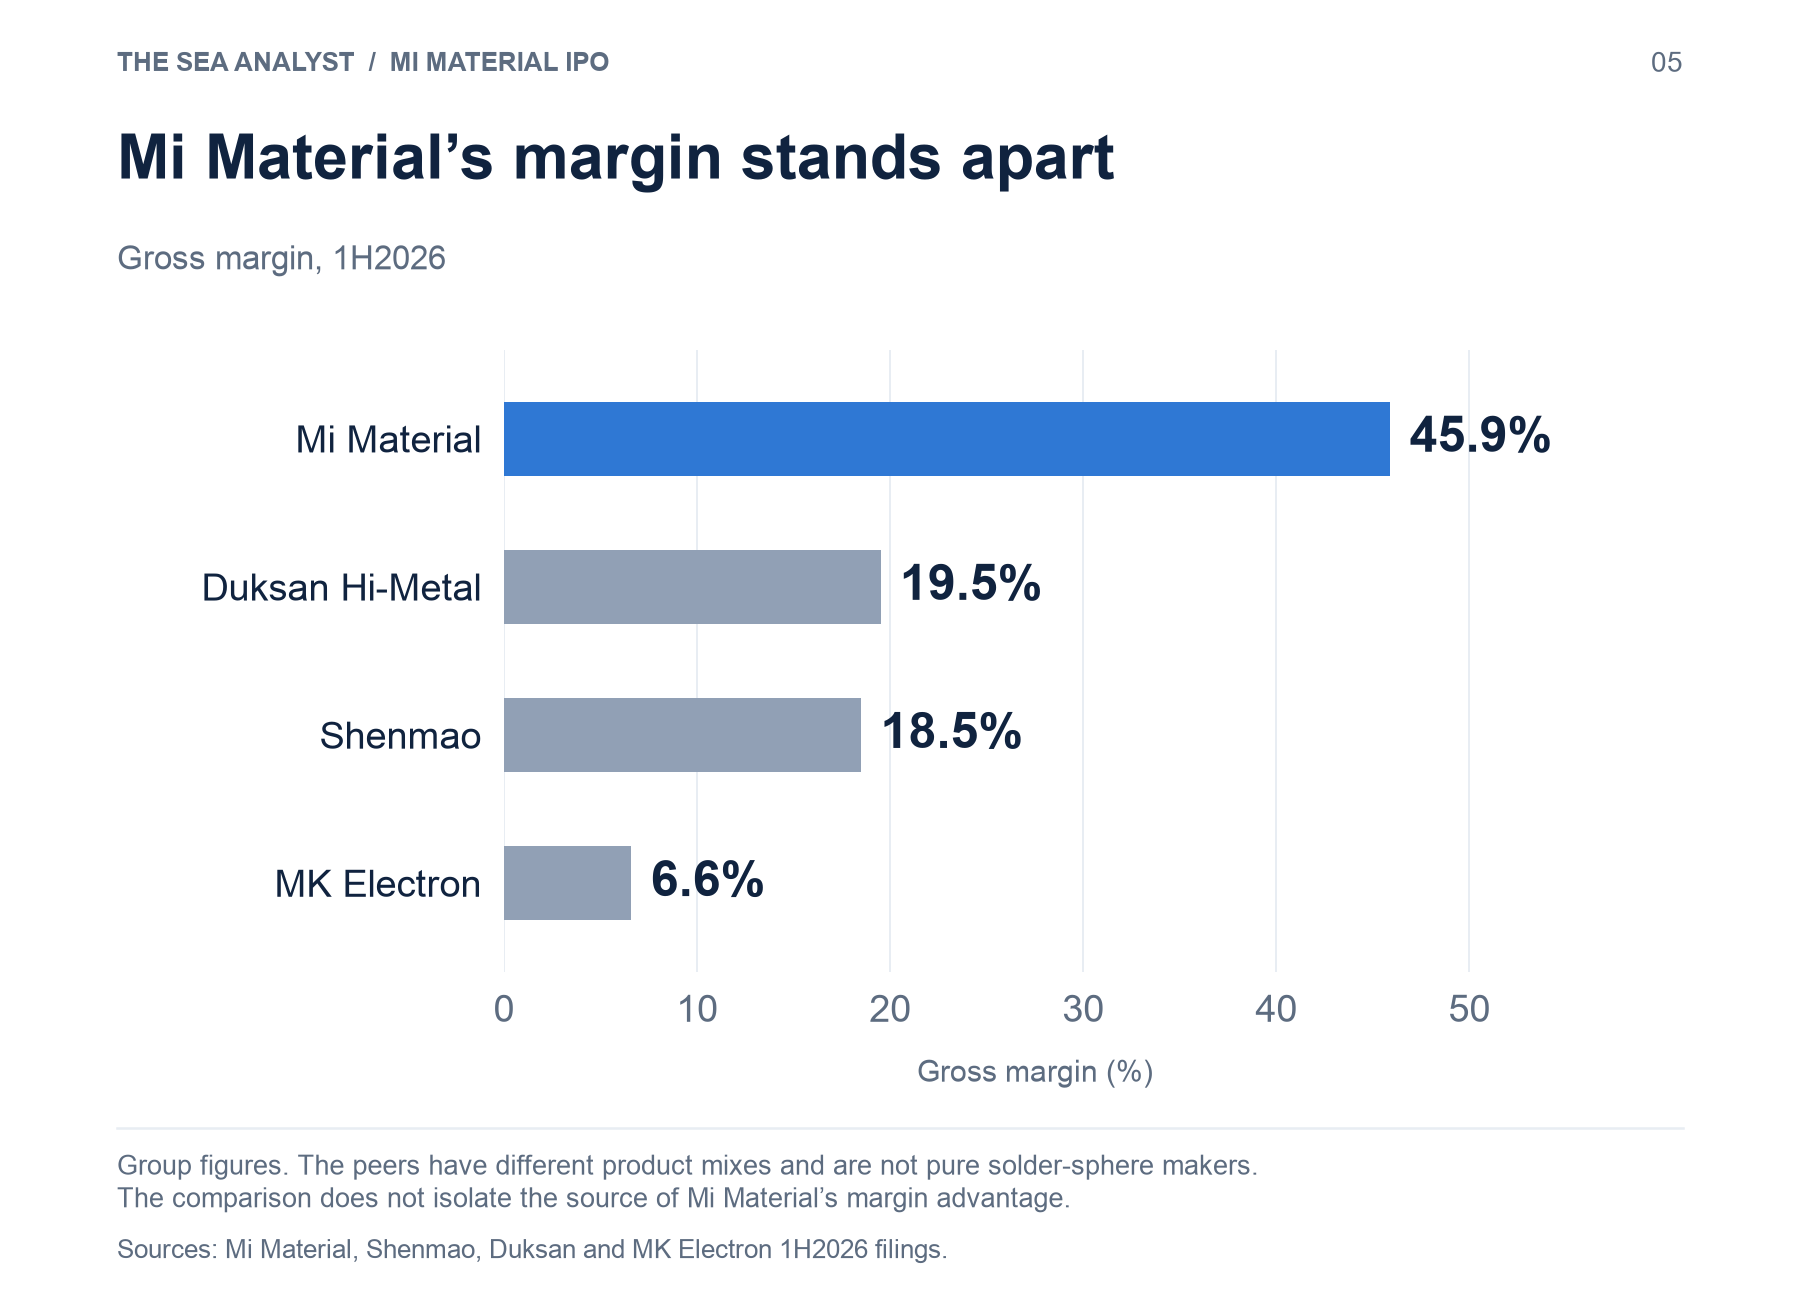
Mi Material’s margins suggest it has an advantage. In 1H2026, it earned much higher gross and operating margins than the three listed solder-sphere makers Yole names as peers.
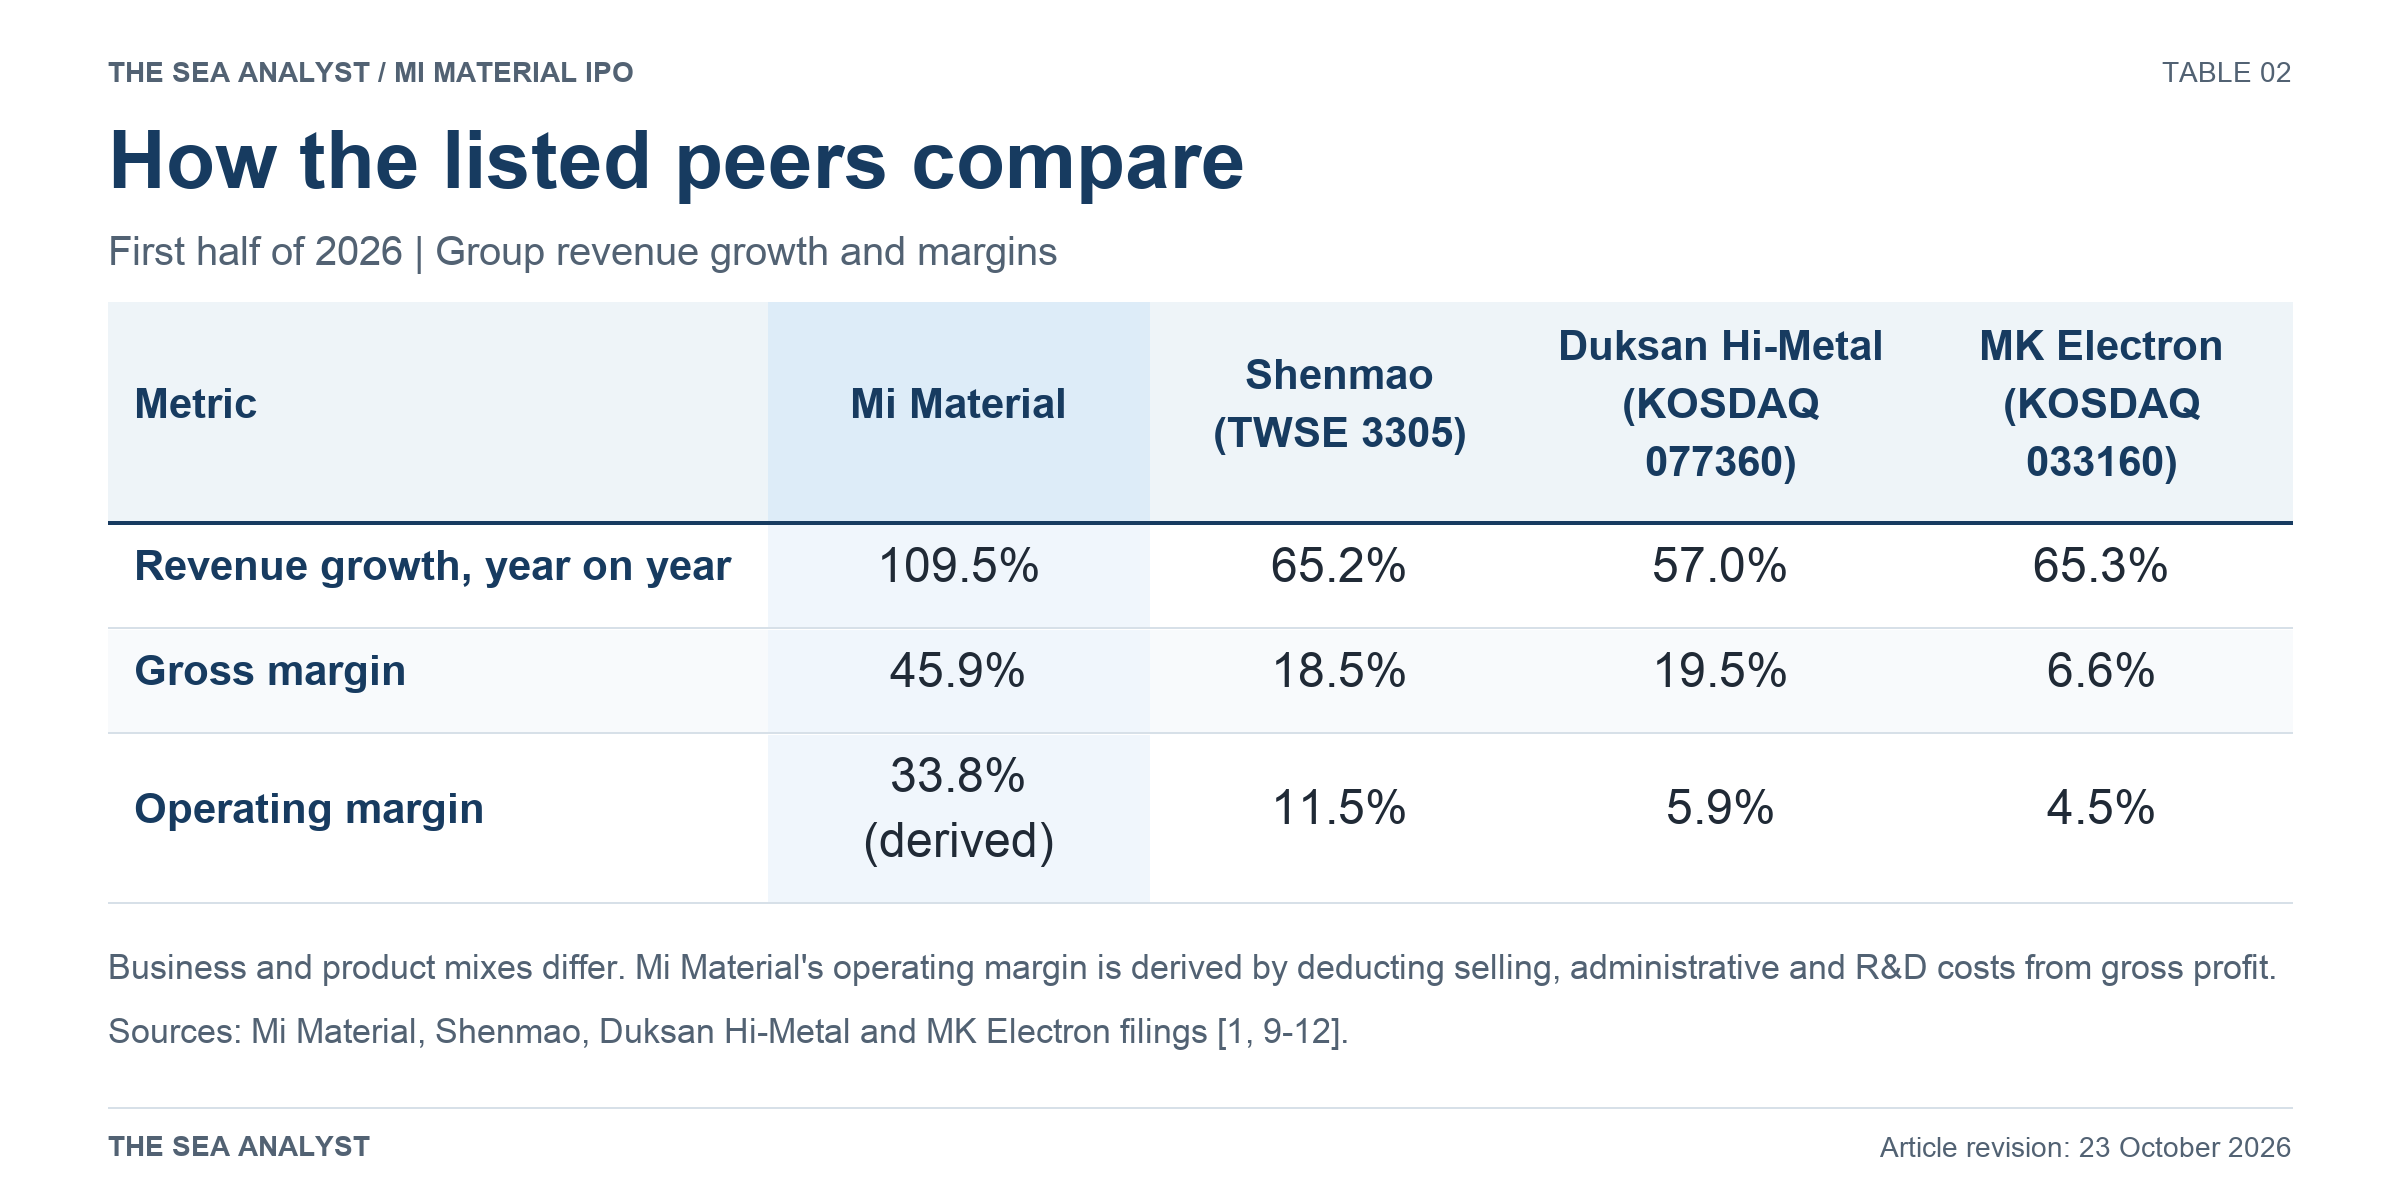
The comparison has limits. Shenmao reports tin bars, balls and wire as a single line, two-thirds of its revenue; Duksan’s broader solder category is 63% of its revenue; solder spheres are about 3% of MK Electron’s [9][11][12]. Their group margins reflect different product and business mixes.
Customer qualification offers a reason Mi Material may sustain a premium. Approval of a new sphere supplier typically takes 12 to 24 months, and up to five years or longer for the most demanding advanced packages. Once a sphere is in an end-customer’s bill of materials, changing it means requalifying. With advanced packaging alone costing several hundred to more than US$1,000 per package [1], small savings on spheres may not justify the risk of a failed connection.
The weaknesses are as concrete. The company sells on purchase orders with no minimum volumes and no long-term contracts. It buys its metal at spot, with no hedging, and negotiates selling prices with customers; the timing of purchases and repricing can affect margins. Its R&D spend was 1.4% of revenue in 1H2026, from 3.0% in FY2023, with 25 R&D staff, all in Taiwan.
Metal supply is concentrated. ThinTech Materials Technology accounted for 50.4% of purchase spending in 1H2026, up from 37.5% in FY2023; the top two suppliers accounted for 71.4% [1]. ThinTech is listed on Taiwan’s Taipei Exchange (3663) and belongs to Taiwan’s China Steel group, with a substantial precious-metals processing and trading business [20]. Mi Material’s relationship with it spans 18 years. The concentration deserves attention, although the percentage measures spending: higher metal prices can increase it without an equivalent rise in physical dependence.
Proprietary products and established customer relationships did not prevent the last downturn. During the industry’s FY2023 inventory correction, revenue fell about 15% and the pre-tax margin dropped from 21.2% to 14.3% [5]. The product mix is stronger today: proprietary alloys supplied about 34% of revenue then, against 60% in 1H2026.
The financial scoreboard
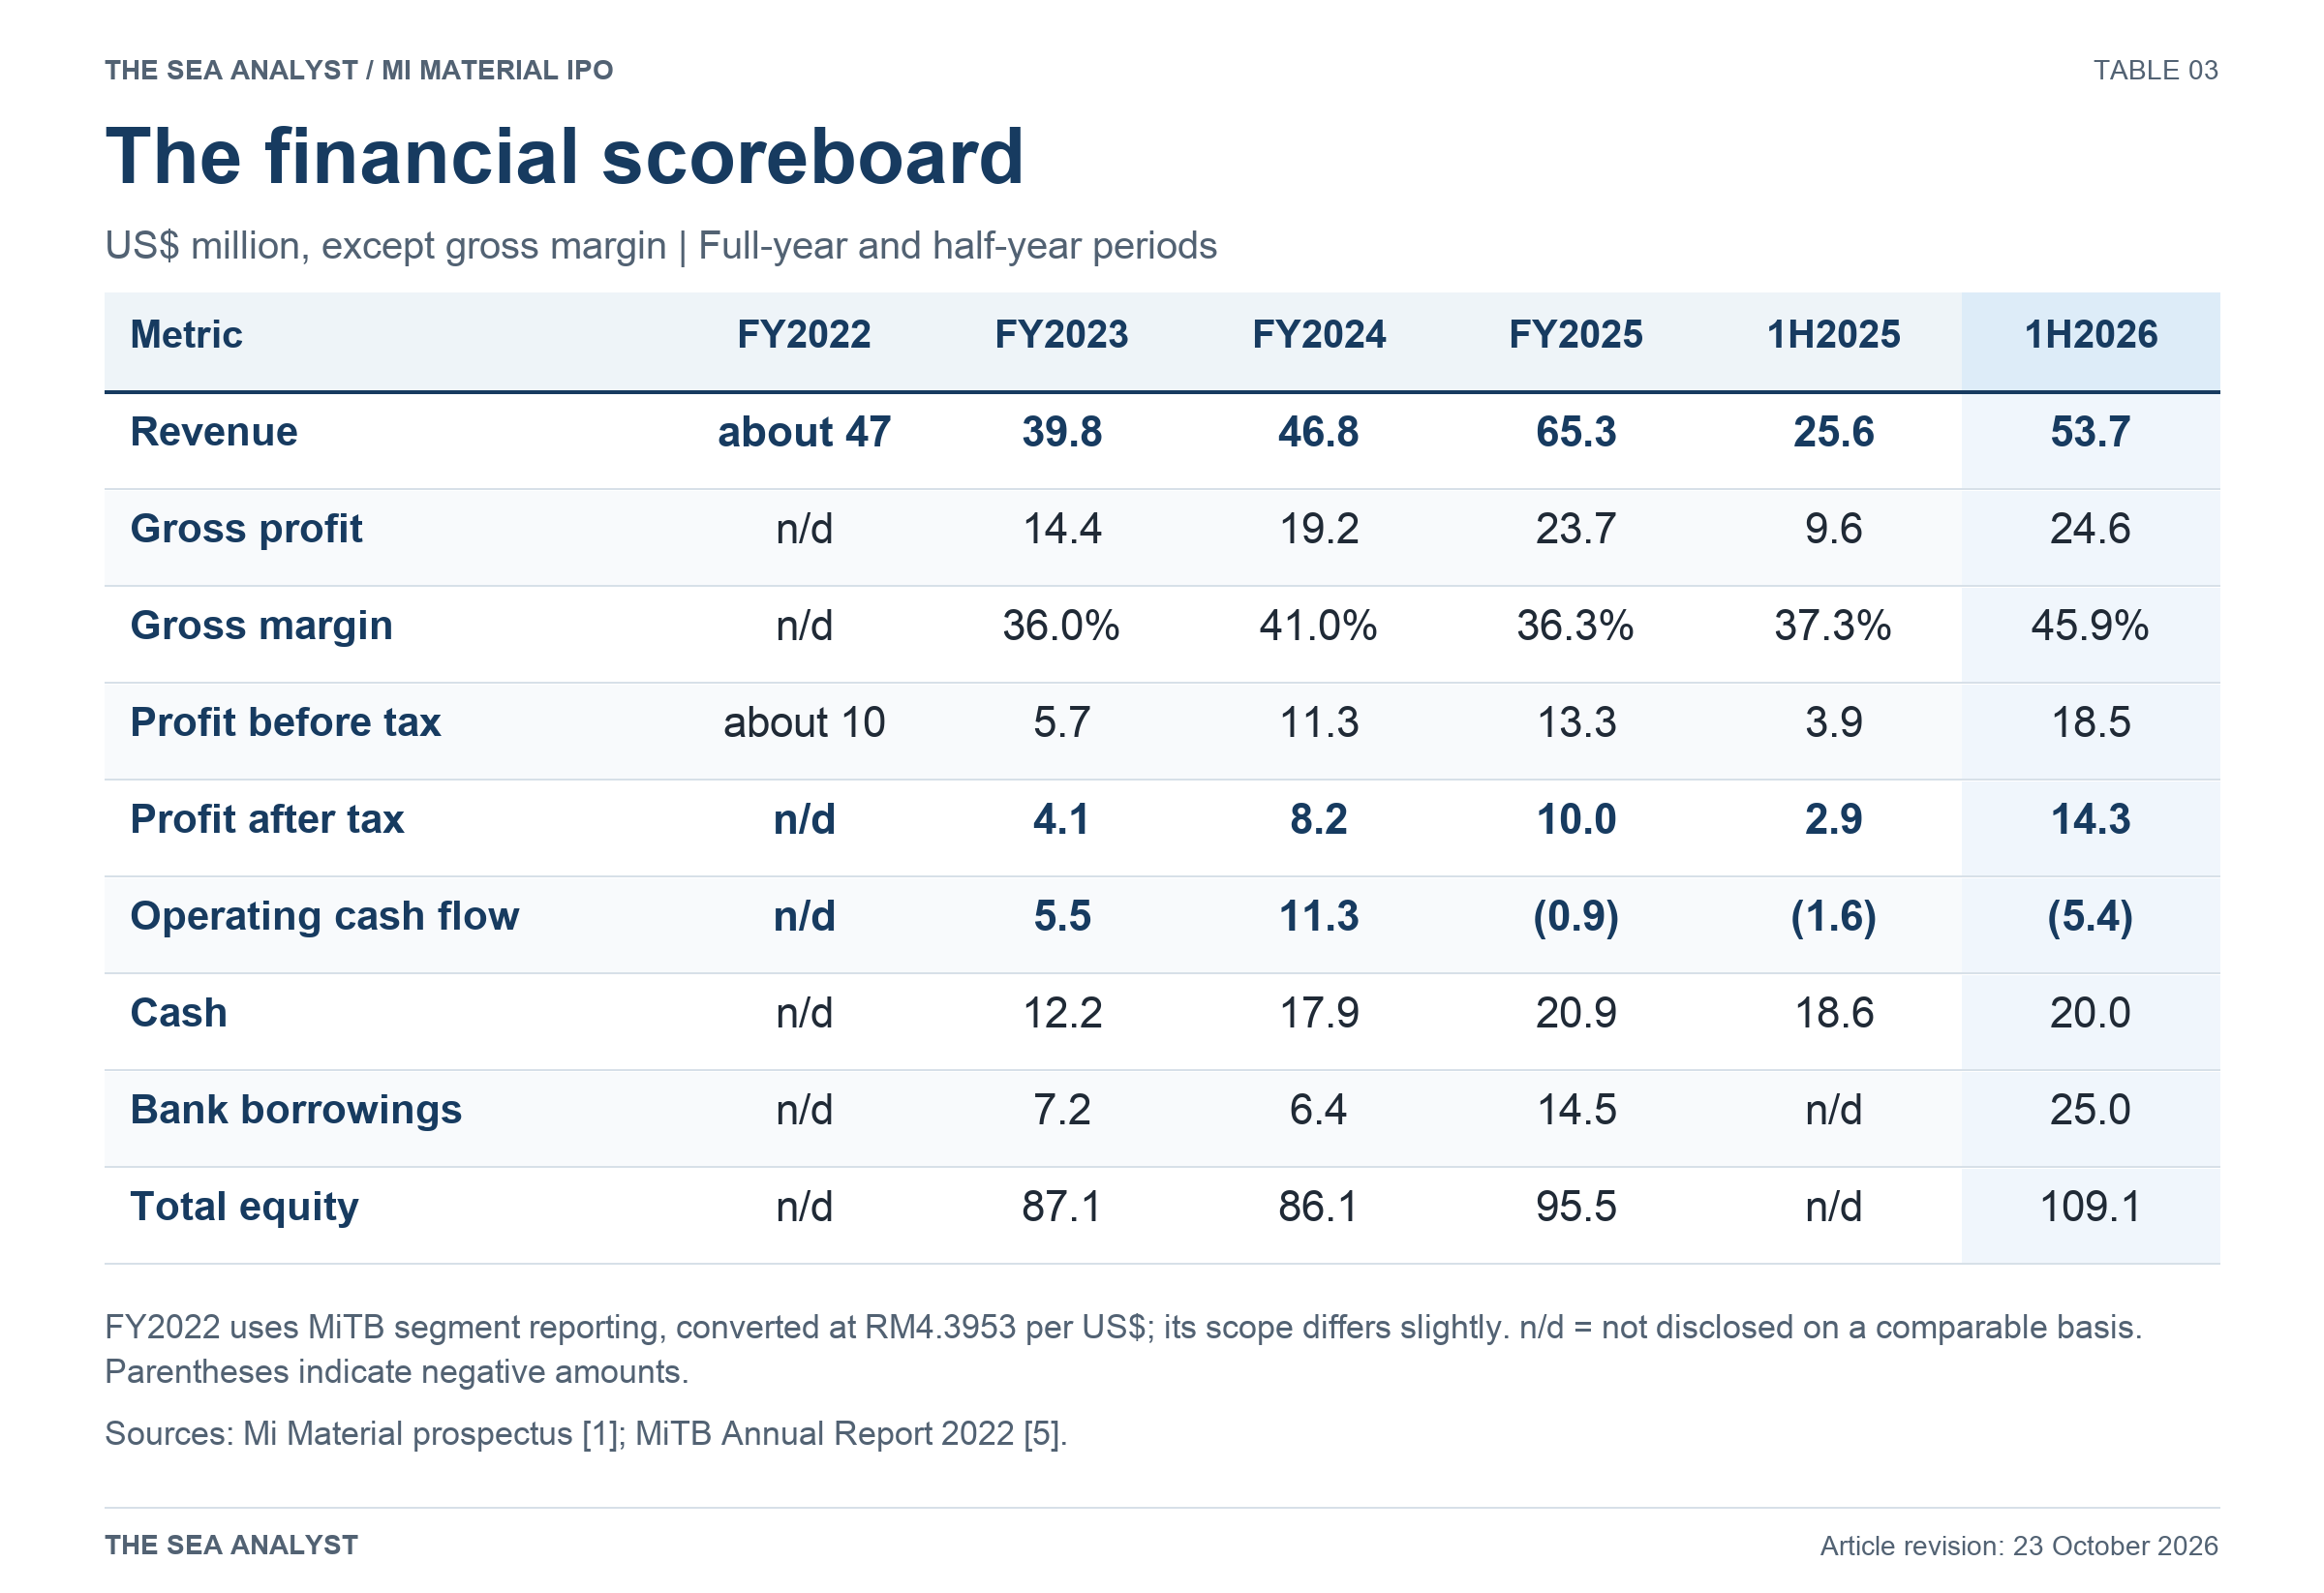
The starting year matters. The prospectus’s 28.1% annual revenue growth over FY2023 to FY2025 begins in a downturn. Measured from FY2022, growth to FY2025 was about 11.6% a year in US dollars.
The first half of 2026 is a clear step up: gross margin reached 45.9%, almost five percentage points above the best of the preceding three full years, and half-year profit exceeded the previous full year’s by 43%. Currency movements helped too. A US$1.69 million exchange loss in 1H2025 became a gain of about US$0.4 million, accounting for roughly US$2.1 million of the US$14.5 million increase in pre-tax profit.
The prospectus’s preliminary 3Q2026 estimates extend that improvement: revenue of US$37.8 million, up 15.6% from the second quarter, and gross margin of 47.5%, against 48.0%. These are unaudited estimates based on management accounts available on 2 October; a fuller business update is still to follow. Management attributes the revenue increase mainly to higher sales volumes, with a similar proportion of specialty alloys and fine-pitch spheres [1]. That supports the demand case, although the company also notes its usual second-half seasonality.
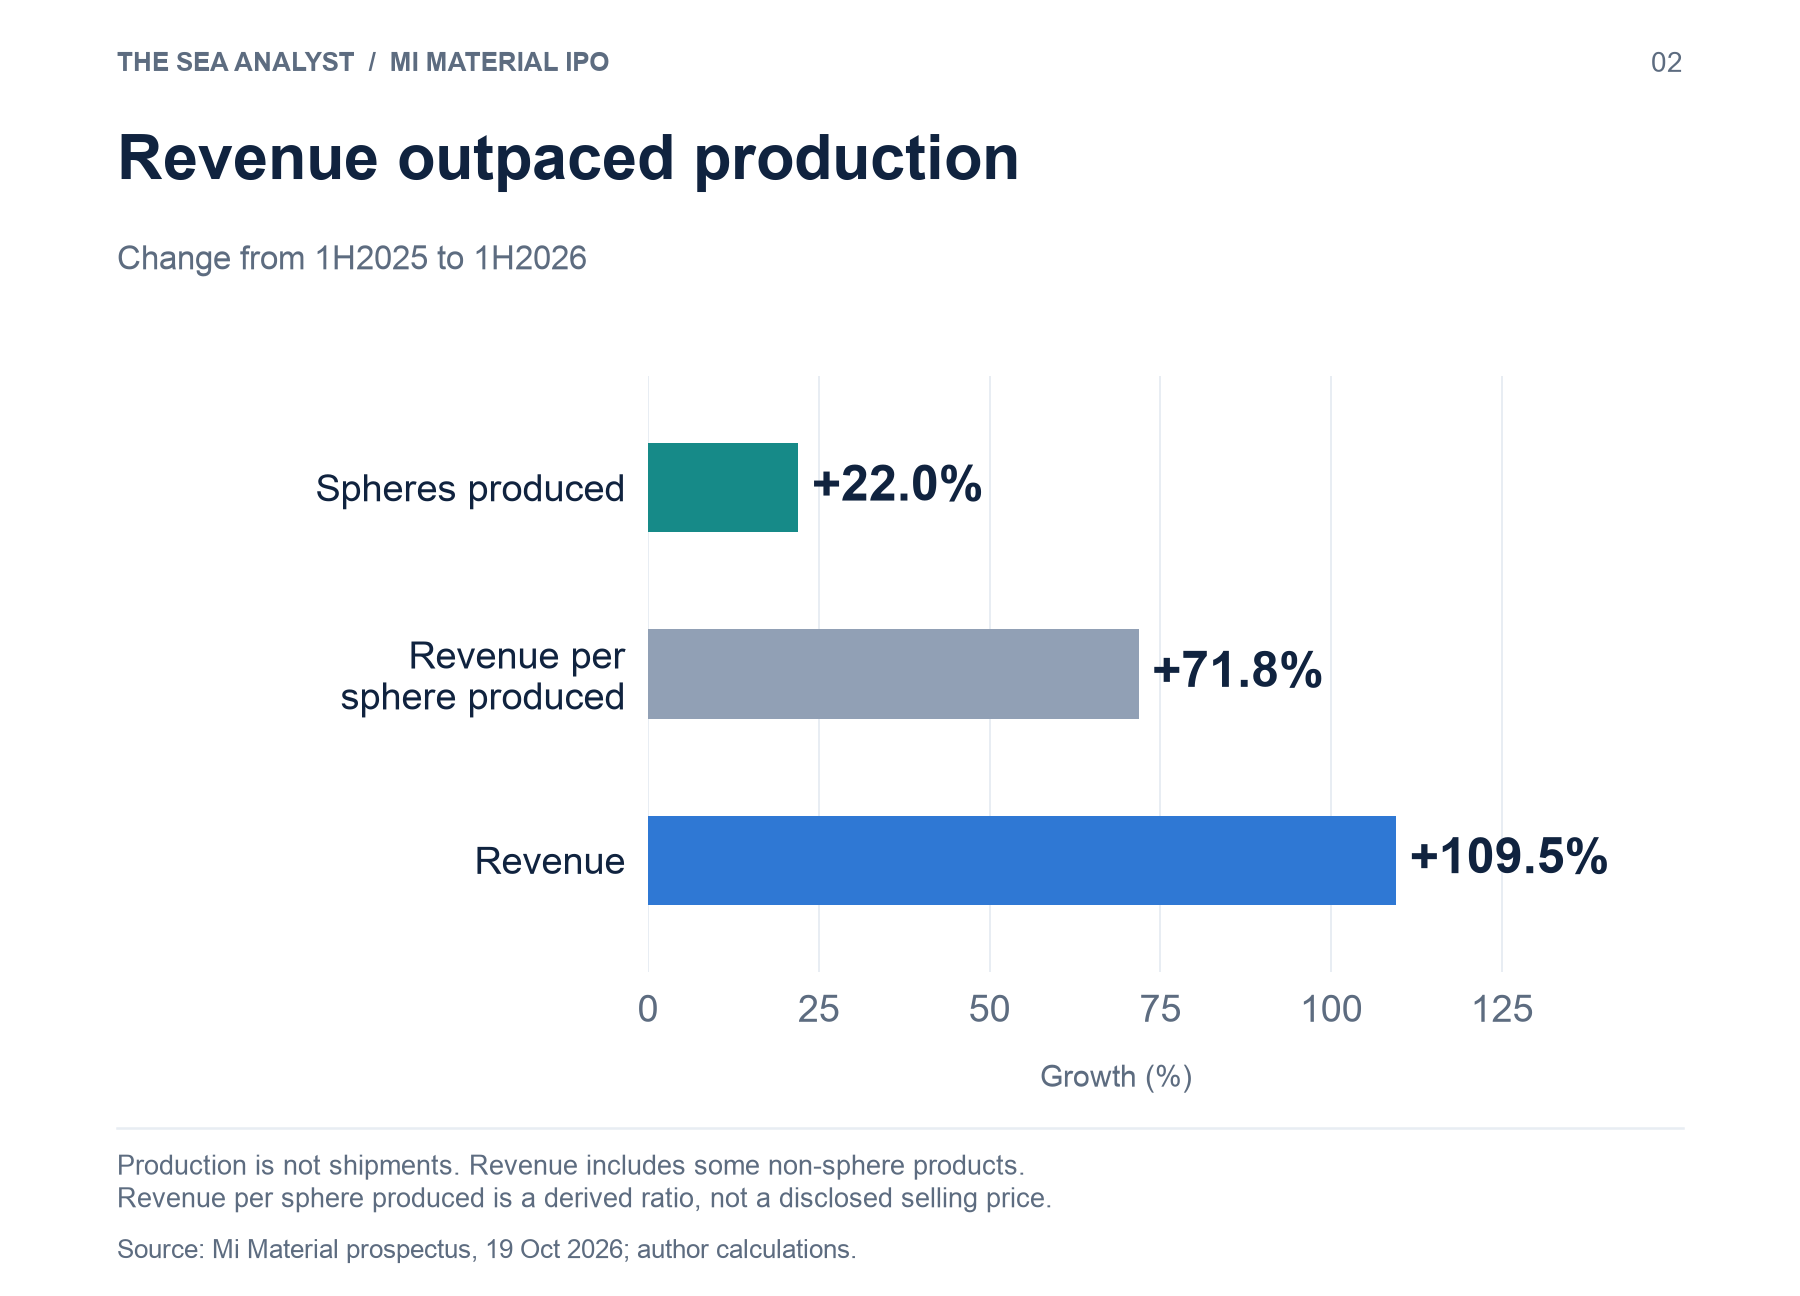
Production rose 22%. Revenue per sphere produced rose 72%
The company does not disclose how many spheres it sold, only how many it made. Spheres produced across Tainan and Ningbo rose 22.0%, from 1,780 billion in 1H2025 to 2,171 billion in 1H2026. Production is not shipments: finished-goods inventory rose by US$3.4 million in the half, and a small part of revenue comes from products other than spheres. If sales tracked production, and each sphere earned what it earned a year earlier, revenue would have risen by only US$5.6 million. Instead, it rose US$28.0 million, about five times as much. On that assumption, volume accounts for about a fifth of the growth, and the other US$22.4 million came from higher prices, a richer mix, or both.
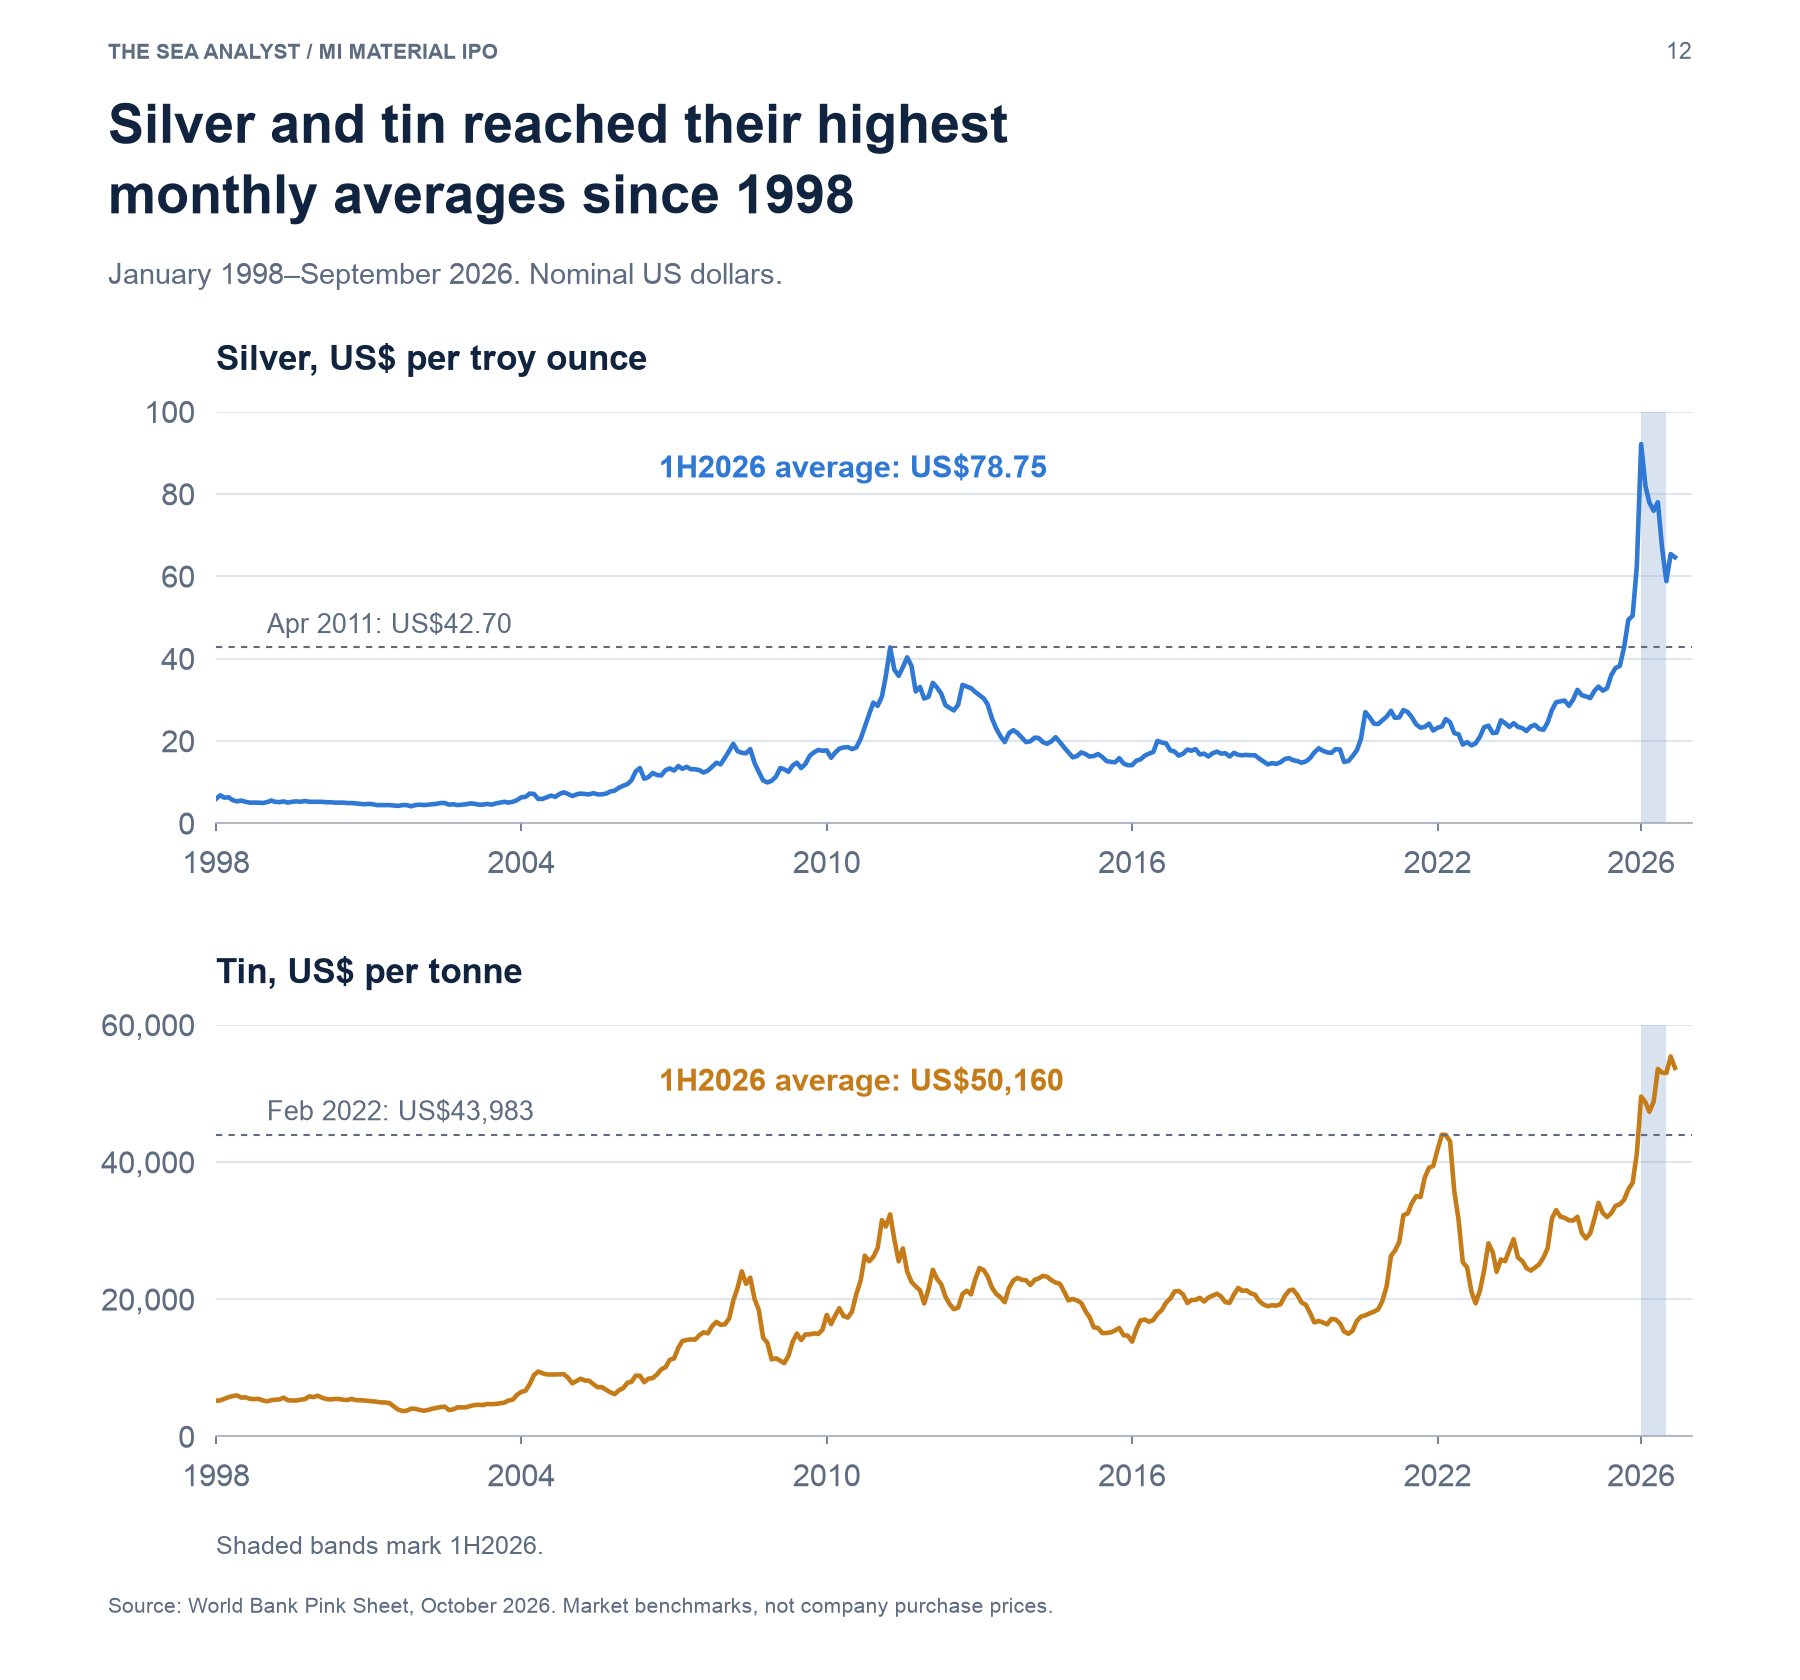
Metal prices are the first place to look. World Bank monthly benchmarks show average silver prices rising 140% between the two halves, from US$32.80 to US$78.75 an ounce, and tin rising 56%, from US$32,097 to US$50,160 a tonne [8].
The 1H2026 averages also exceeded earlier nominal price peaks: US$42.70 an ounce for silver in April 2011 and US$43,983 a tonne for tin in February 2022 [8]. For comparison, Accurus paid between US$14.13 and US$19.31 an ounce for silver over 2017 to 2019, before MiTB bought the business [3].
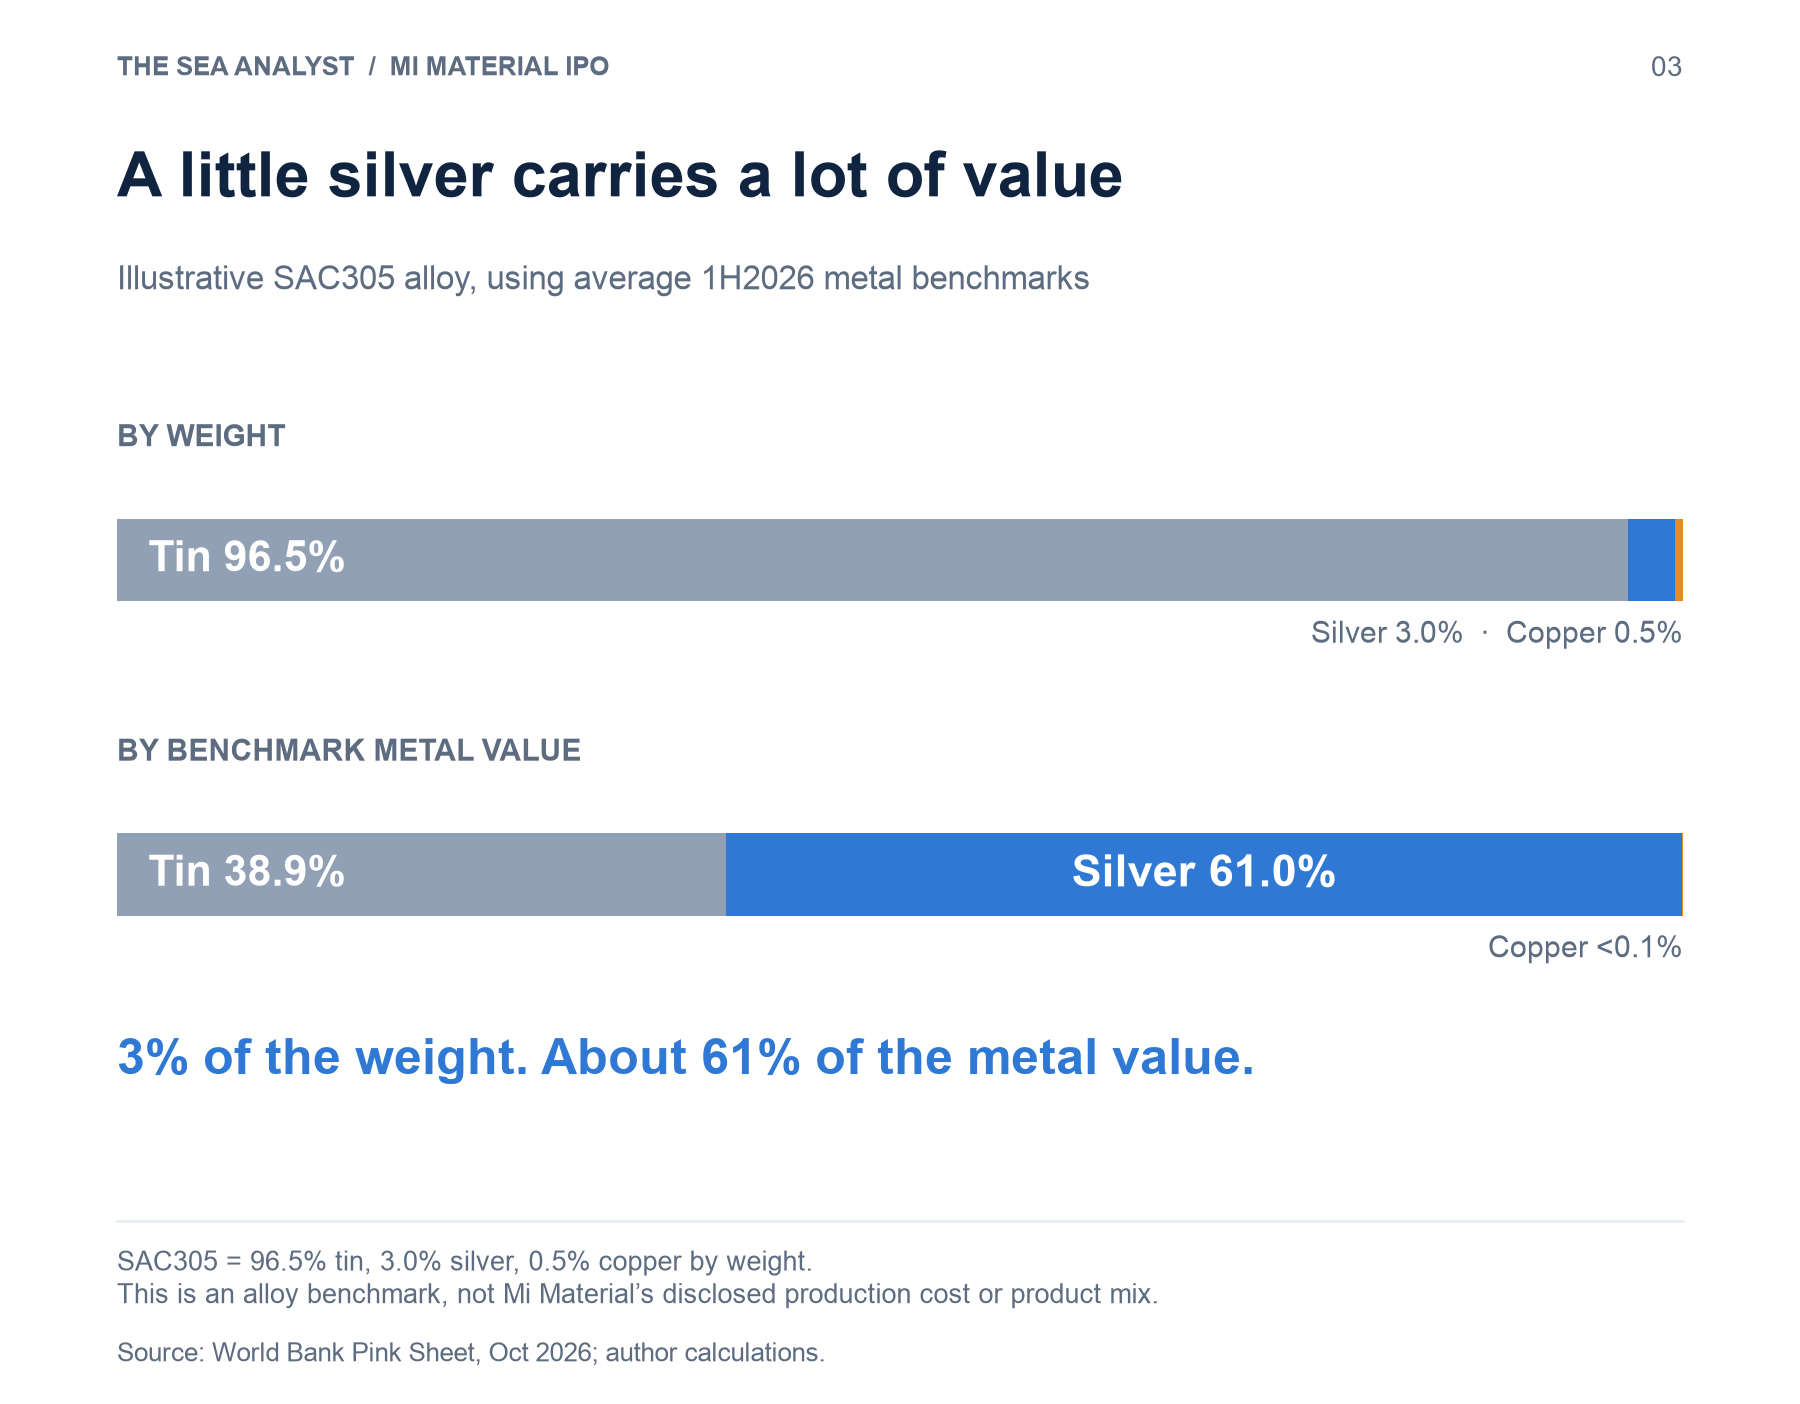
To show the combined effect on alloy costs, we use SAC305: 96.5% tin, 3% silver and 0.5% copper by weight. Our illustrative “metal basket” measures the benchmark cost of those ingredients in one kilogram of alloy. It roughly doubled from US$63 in 1H2025 to US$124 in 1H2026. This is a reference point, not Mi Material’s actual product mix or purchase cost.
Management attributes the 1H2026 revenue increase to higher volumes, more specialty and fine-pitch spheres, and higher selling prices as it passed on rising raw-material costs. Silver and tin made up 89.2% of purchase spending in the half [1].
The peers show that the boom extends beyond Mi Material. Their revenue rose 57% to 65% in the same half [10][11][12]. Shenmao and MK Electron widened their gross margins; Duksan’s slipped from 19.8% to 19.5%. All faced rising metal prices, but their different margin outcomes leave room for company-specific pricing and product effects.
AI packaging can also change what customers buy. More complex packages need different numbers, sizes and types of connection. Smaller spheres are harder to make, while some powerful computing chips need larger spheres that use more metal [1]. Higher-value sales can therefore come from several changes in product mix.
Higher metal costs alone cannot explain the gross-profit gain. Passing those costs to customers dollar for dollar raises revenue and costs equally, leaving gross profit unchanged. Mi Material’s gross profit rose US$15.1 million.
Assuming sales tracked production, 22% more volume at the old gross profit per sphere would explain only US$2.1 million of that increase. That leaves US$13.0 million to explain. Possible contributors include higher-value products, stronger pricing, markups on metal, selling prices rising before older inventory costs catch up, and fixed factory costs spread over more output. The accounts do not separate these effects.
The quarterly pattern gives a better clue to how much may last. Our SAC305 basket fell from about US$128 a kilogram in 1Q2026 to US$121 in 2Q and US$113 in 3Q. Tin and copper rose between the first and third quarters, but silver’s decline more than offset them [8].
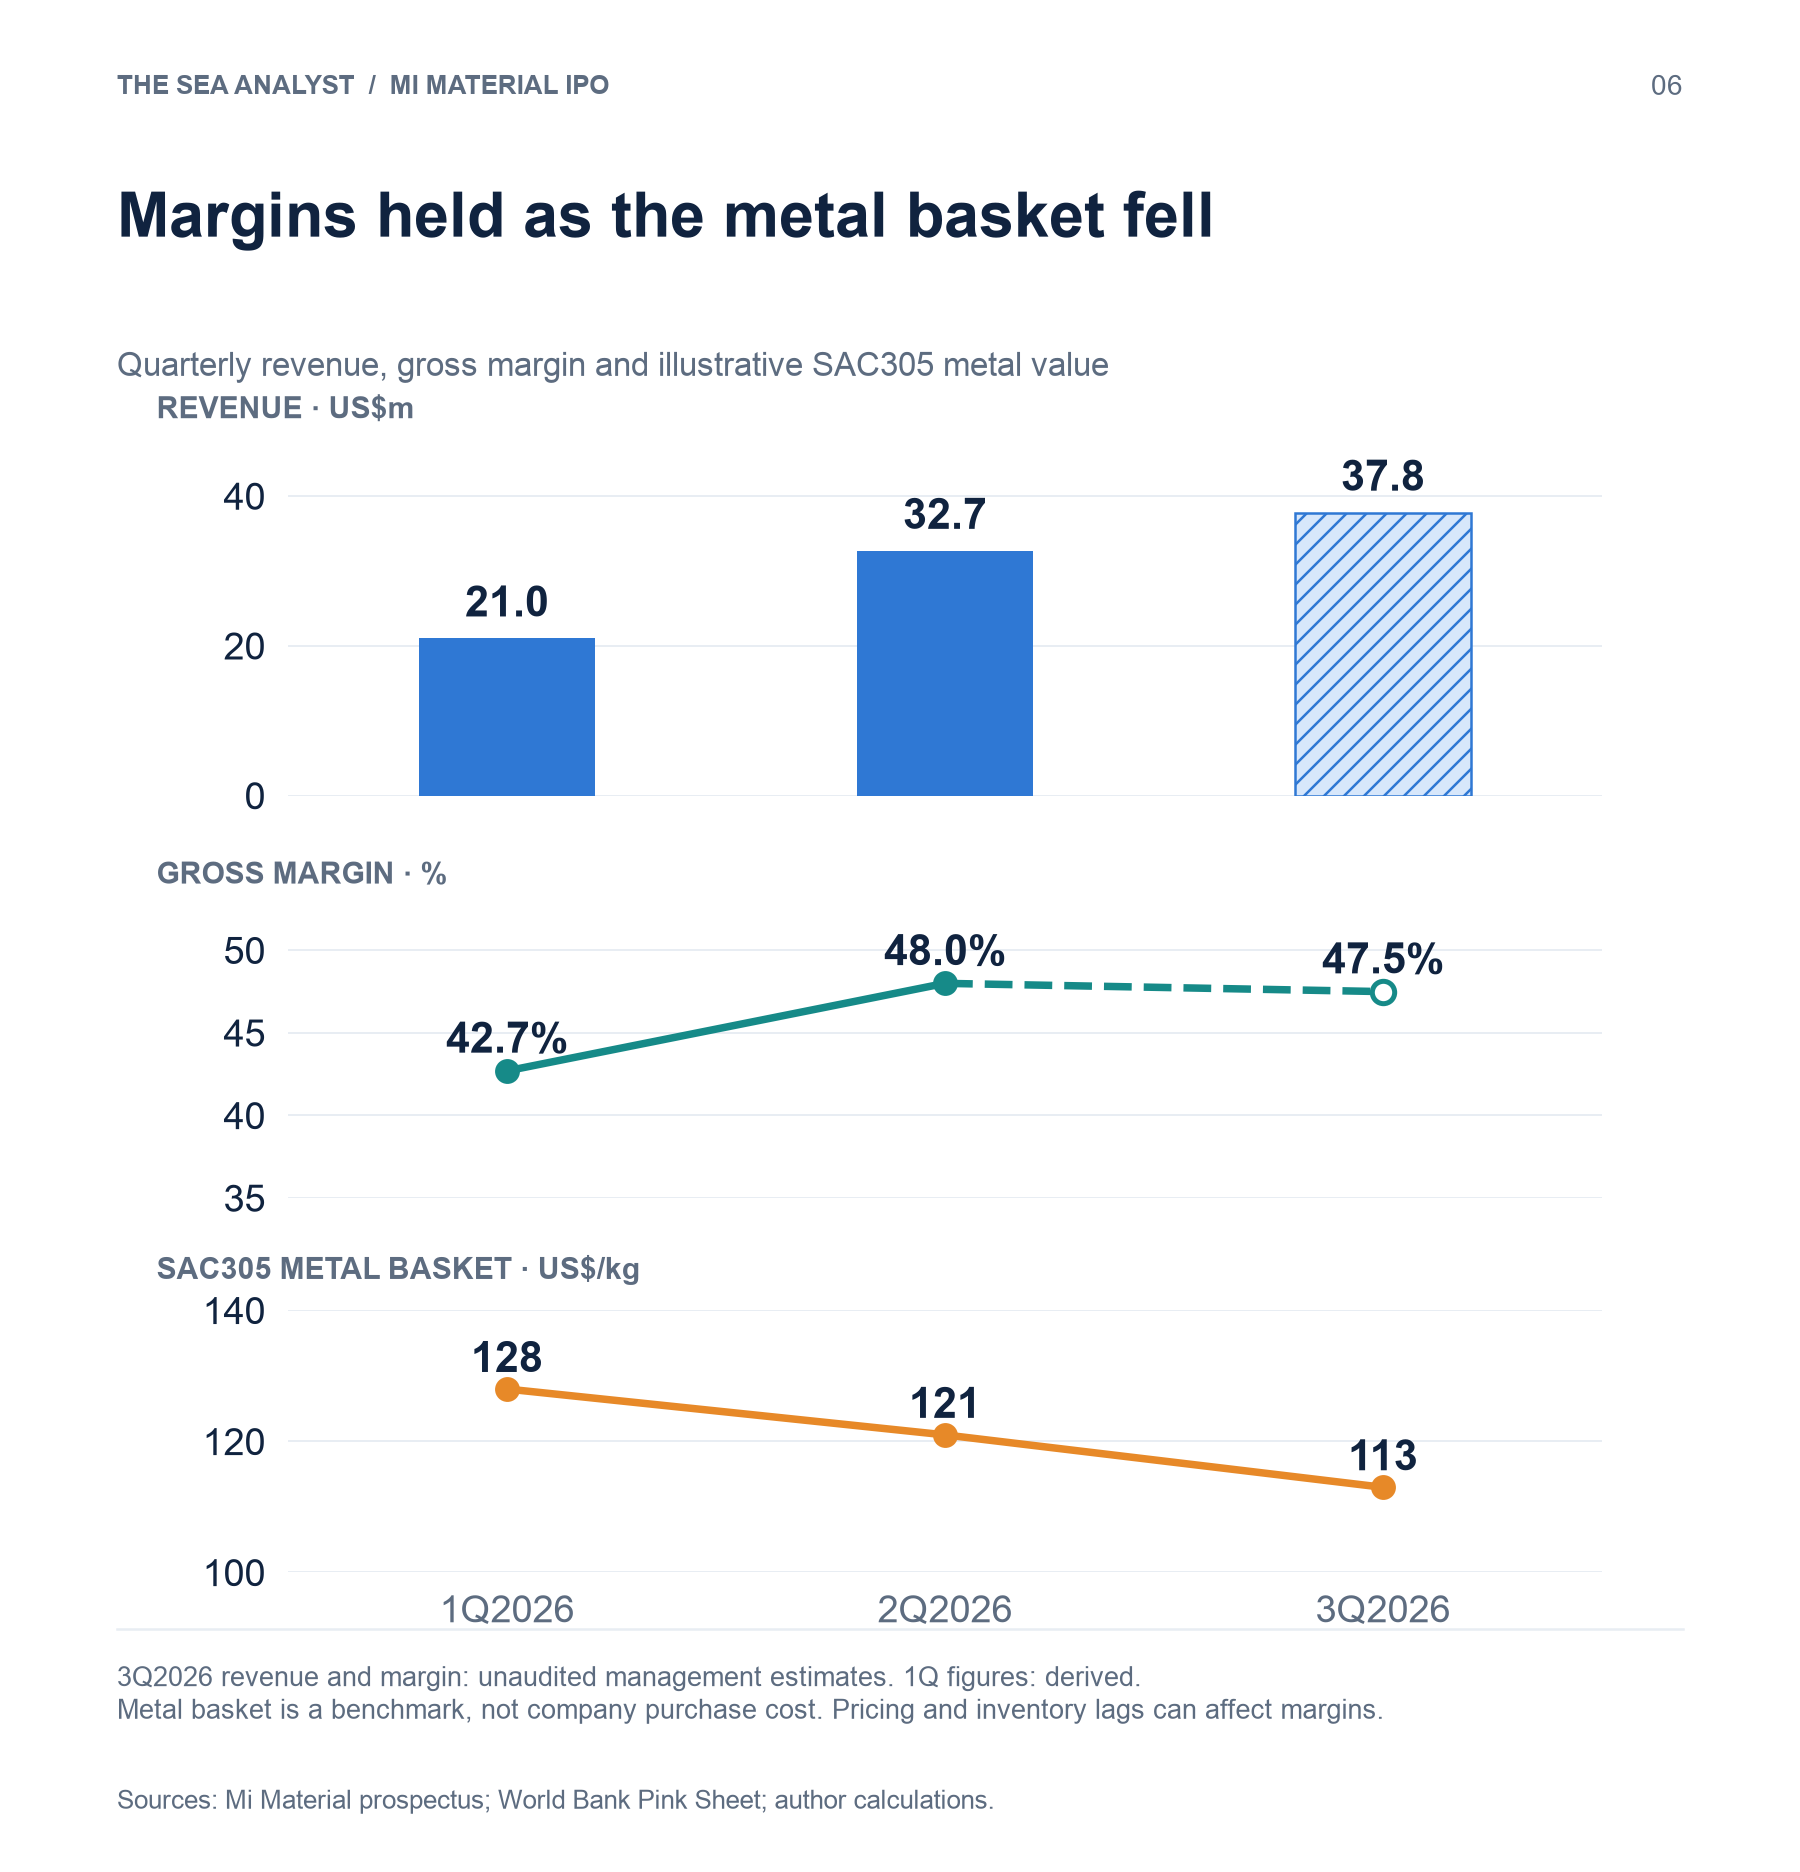
Over those quarters, revenue rose from about US$21.0 million to US$32.7 million and an estimated US$37.8 million. Gross margin rose from about 42.7% to 48.0%, then held at an estimated 47.5%. Together with management’s account of higher Q3 sales volumes, this weighs against an improvement driven entirely by metal prices. Pricing and inventory timing could still affect margins; the accounts do not establish how much.
Our illustrative calculation puts at-cost metal pass-through at 14% to 41% of revenue growth, depending on the assumed metal share of costs; the data notes set out the assumptions. The profit gain needs more than pass-through to explain it. By September, silver averaged US$64.6 an ounce, 30% below January’s US$92.1 peak [8]. That gives investors a useful test: can margins hold and profit turn into cash as the metal tailwind fades?
Below: the cash tied up in growth, where the seller’s money is going, and what the S$1.80 offer price assumes about future earnings. Our three valuation scenarios range from S$0.68 to S$2.92 a share.